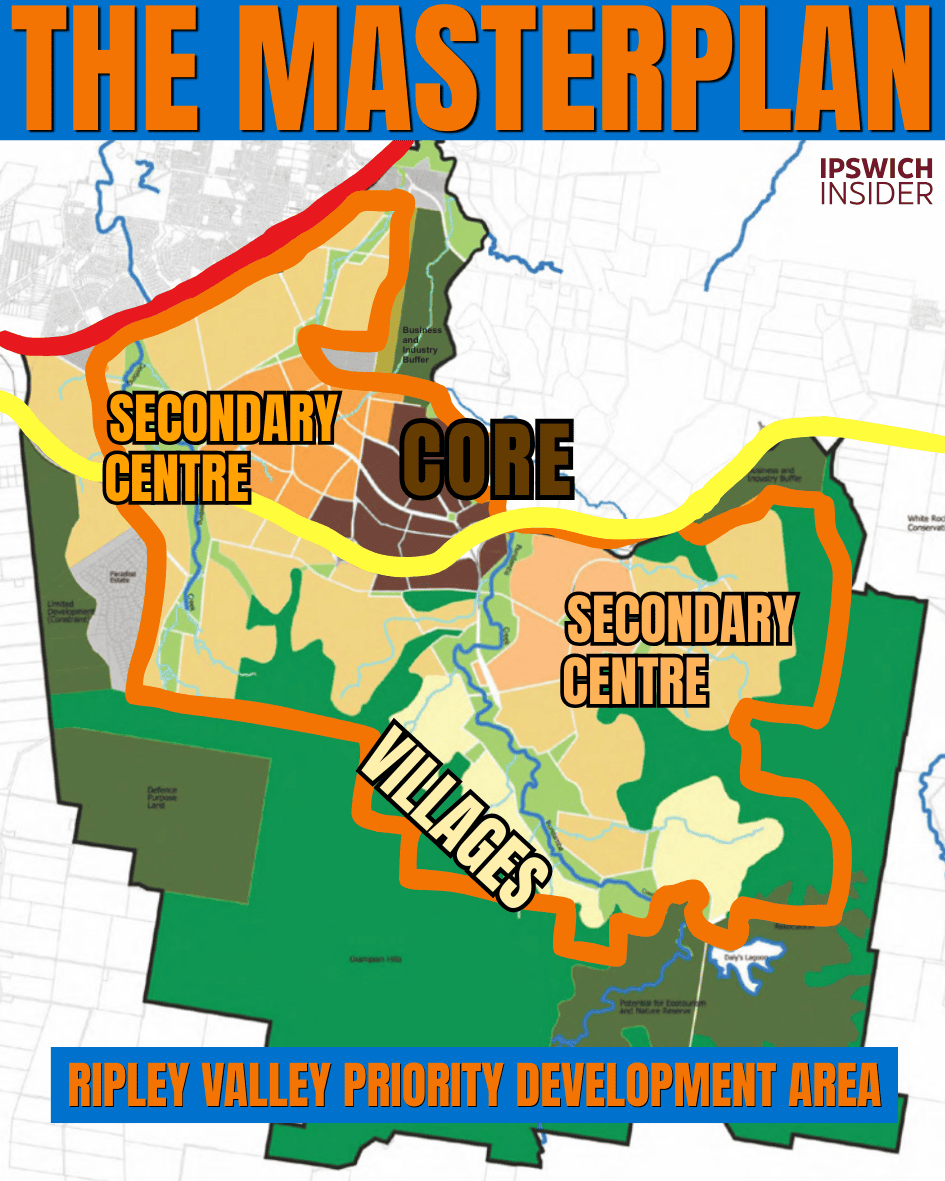
The Masterplan at a Glance
- The vision. High density living, not character Ipswich sprawl. A regional centre at the heart: think Springfield Central, not Karalee shopping village. Tall buildings up to 12 storeys, 100 dwellings per hectare. With smaller centres, walkable neighbourhoods, and public transport stitching it all together.
- The development scheme. A legal rulebook Council assesses PDA applications against. It overrides the Ipswich City Plan. Last updated July 2025.
- The concept design. A future city built as one system. A public transport spine connecting it through the middle and outwards to the greater SEQ network. With road arteries and walk and cycle capillaries linking smaller neighbourhood centres.
This is Part 2 of The Rise of Ripley. In Part 1 we looked at: Why the Queensland Government chose the Ripley Valley as a Priority Development Area in the first place. Check out Part 1 →
🔢 By The Numbers
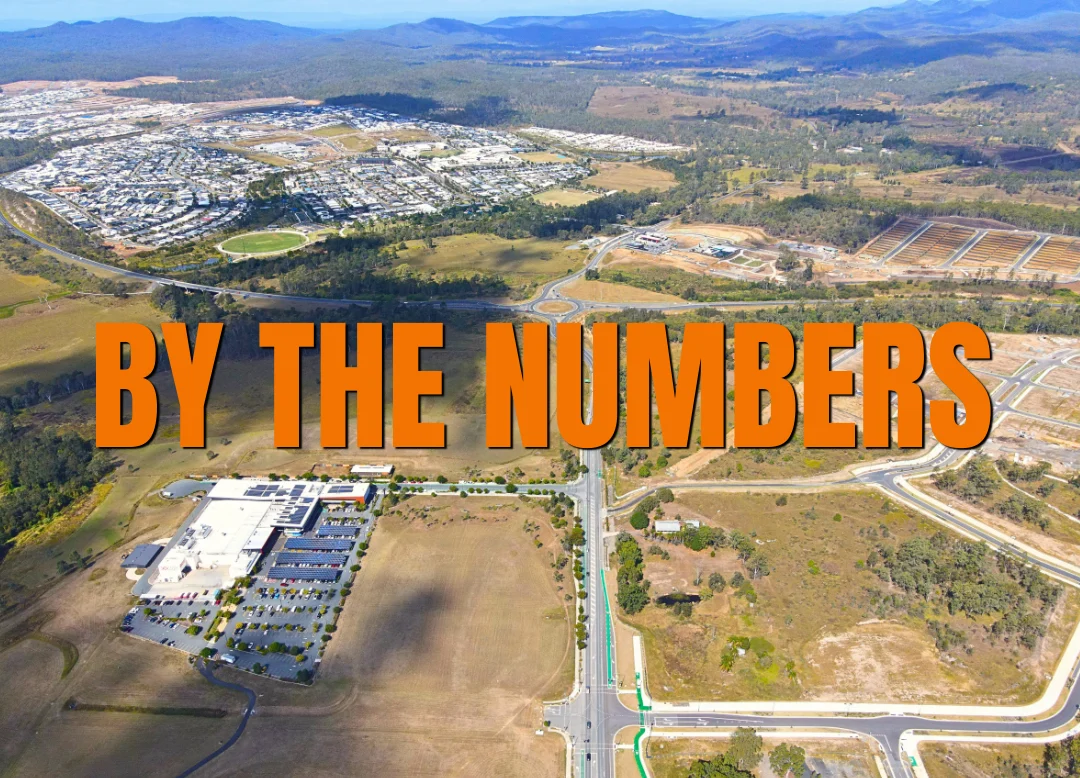
- 2010 – the year the state declared the PDA
- 12 storeys – maximum building height allowed in the urban core
- 100 – maximum dwellings per hectare in the urban core
- 400 metres – maximum distance 90% of homes should be from a future transport stop
- 5 minutes – the target walk to a neighbourhood focal point
- 3 tiers – of centres in the planned hierarchy (urban core, secondary, neighbourhood)
- $1 million – TMR funding for active transport crossing planning at the Centenary roundabout
- 1 July 2025 – the date of the most recent development scheme amendment
What do you see driving past Ripley Town Centre?
Coles?
Anytime Fitness?
Those carpark solar panels?
The 2011 Masterplan saw something very different…
…12 storey buildings.
Apartments above shops.
A future transit interchange.
All of it locked into a planning document that still runs the valley today: the Ripley Valley Priority Development Area Development Scheme.
We made 11 graphics to walk you through it.
Jump to
The Transport Spine
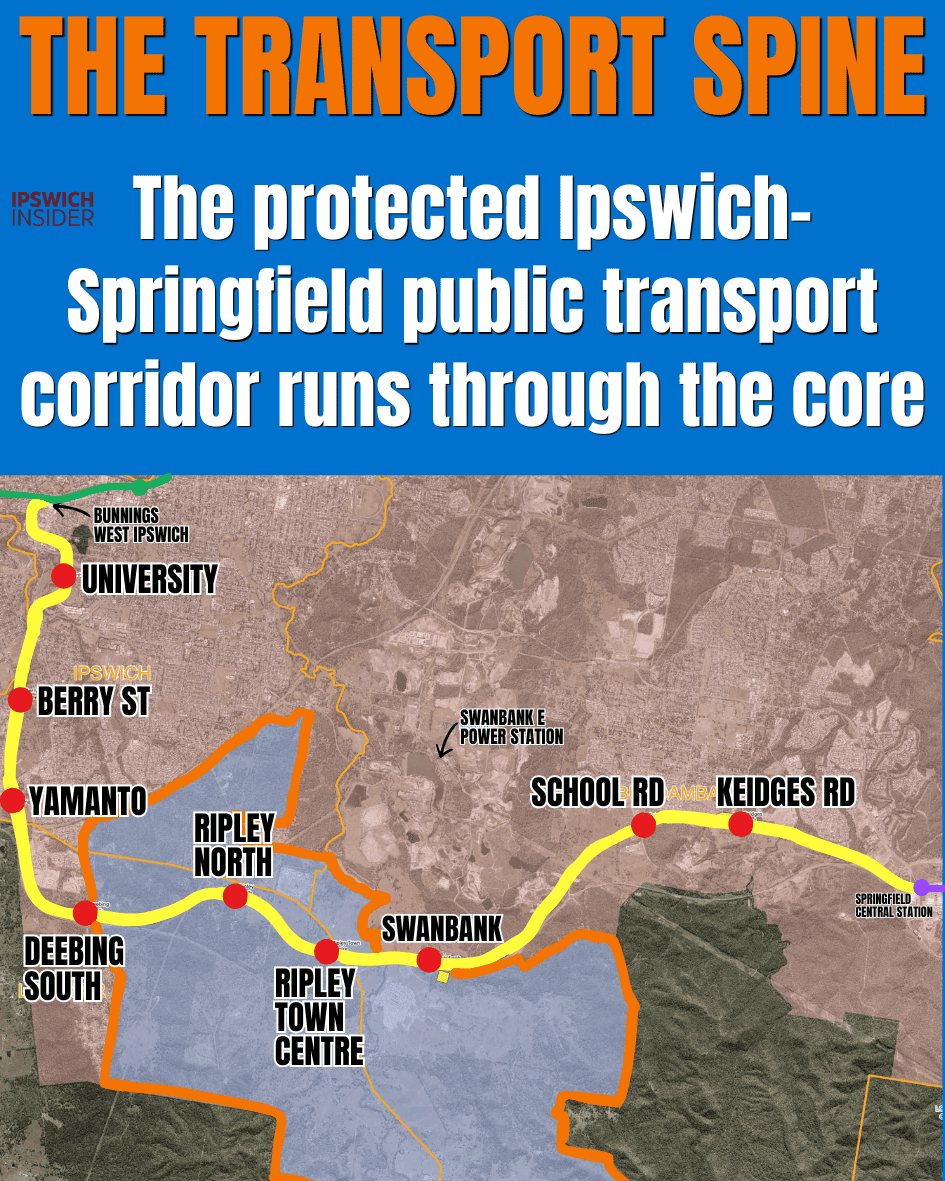
Protected Since 2007
This isn’t a road.
It isn’t a built train track either.
It’s a strip of land the state has kept clear since 2007, blocking any development that would make future high capacity public transport harder to deliver.
Land kept clear for nearly twenty years
- Protected since 2007. TMR has kept this corridor free of incompatible development for nearly 20 years.
- Rail was the planning assumption. The 2008 environmental impact statement assumed heavy rail because it needs the most space. No final mode has been formally approved.
- Stations are proposed, not locked in. TMR’s 2016 corridor map shows proposed stations at Ripley North and Ripley Town Centre. These are planning locations. Not approved. Not funded. Not on a timeline.
- Funded for planning, not building. State funding currently covers the business case and next stage planning work. No construction money is on the table as of May 2026.
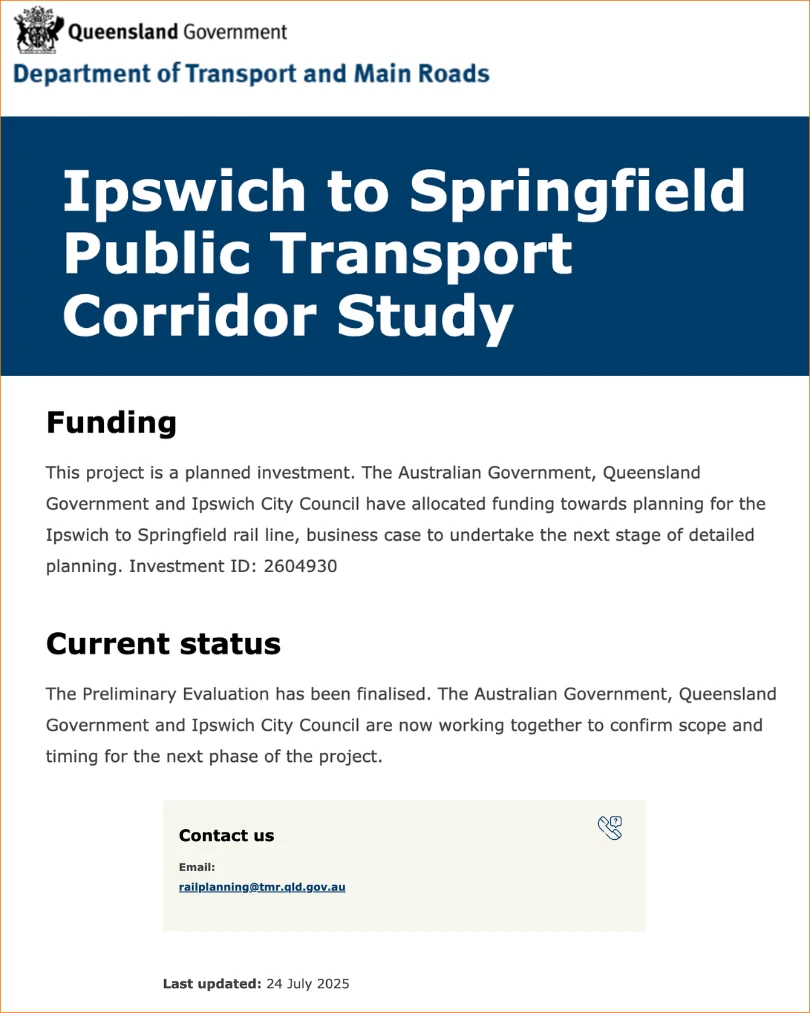
Current status of Ipswich to Springfield public transport corridor planning
- Tied to the urban core. The 2011 scheme placed Ripley Town Centre on the corridor.
The Town Centre Heart
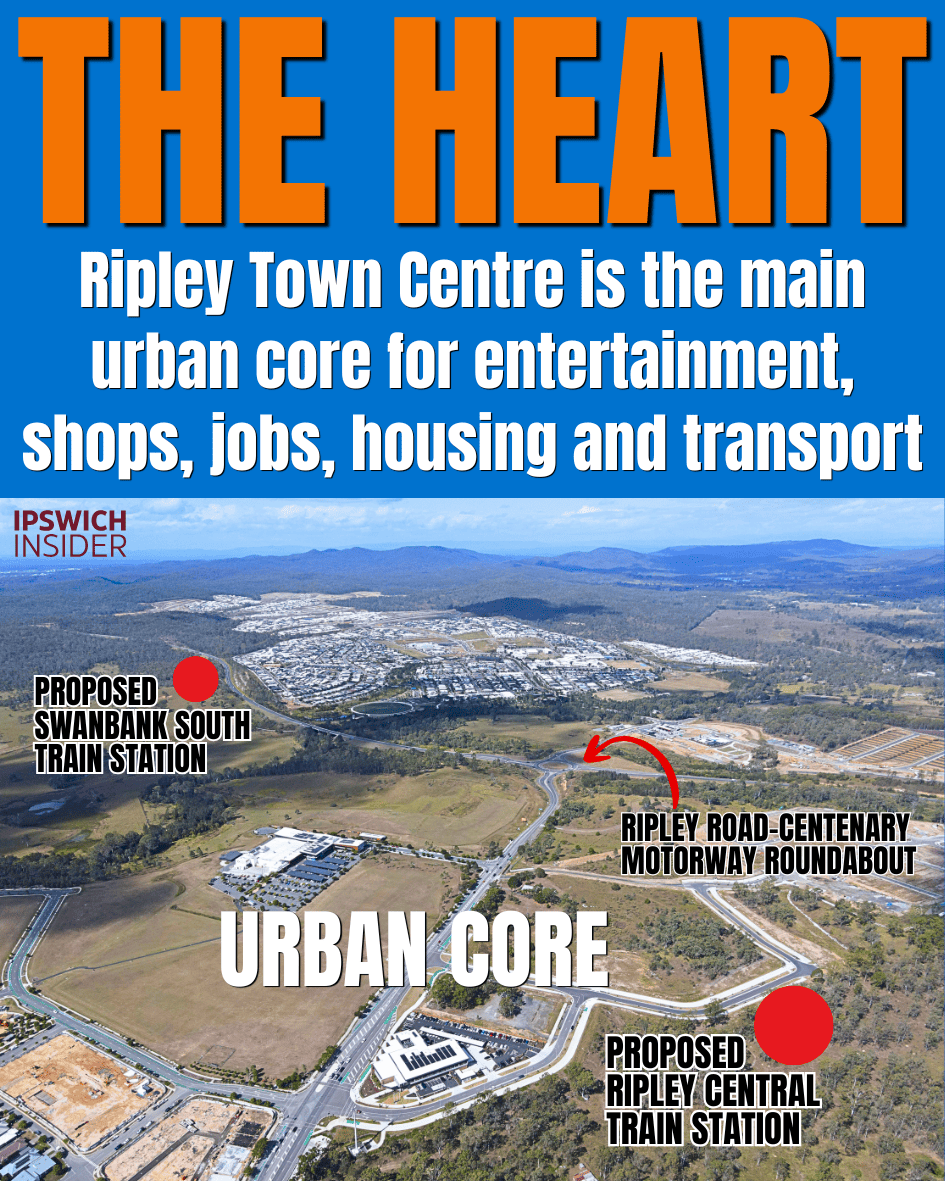
Bigger Than A Coles
Most locals see Ripley Town Centre as the Coles next to Anytime Fitness.
The 2011 masterplan saw something very different.
The scheme planned Ripley Town Centre as the highest order mixed use centre for the whole valley.
Not just a shopping village: something more like Springfield Central.
Buildings up to 12 storeys. 100 dwellings per hectare.
Shops, apartments, offices, services, a future transit interchange. The lot.
What “urban core” actually means in the masterplan
- 12 storeys across the core, not just one tower. Table 1 of the 2011 scheme sets the maximum building height at 12 storeys.

- 50 to 100 dwellings per hectare. The urban core was meant to be the densest part of the valley. For scale (estimate): a character street in Eastern Heights or Sadliers Crossing typically works out to around 15 dwellings per hectare.
- Highest order centre for the whole PDA. This was meant to service the entire valley, not just Ripley. Major retail. Employment. Health. Education. Higher density living. Civic uses. All in one place.
- Tied to the future station. The scheme says the main street should run from the proposed railway station down to open space linked to Bundamba Creek. The town centre and the transport spine were designed as one piece.
- Staged growth built in. Parts of the centre were held back for longer term development based on population thresholds. Stage 1, the current Coles, is the tip of the iceberg.
The Original Plan
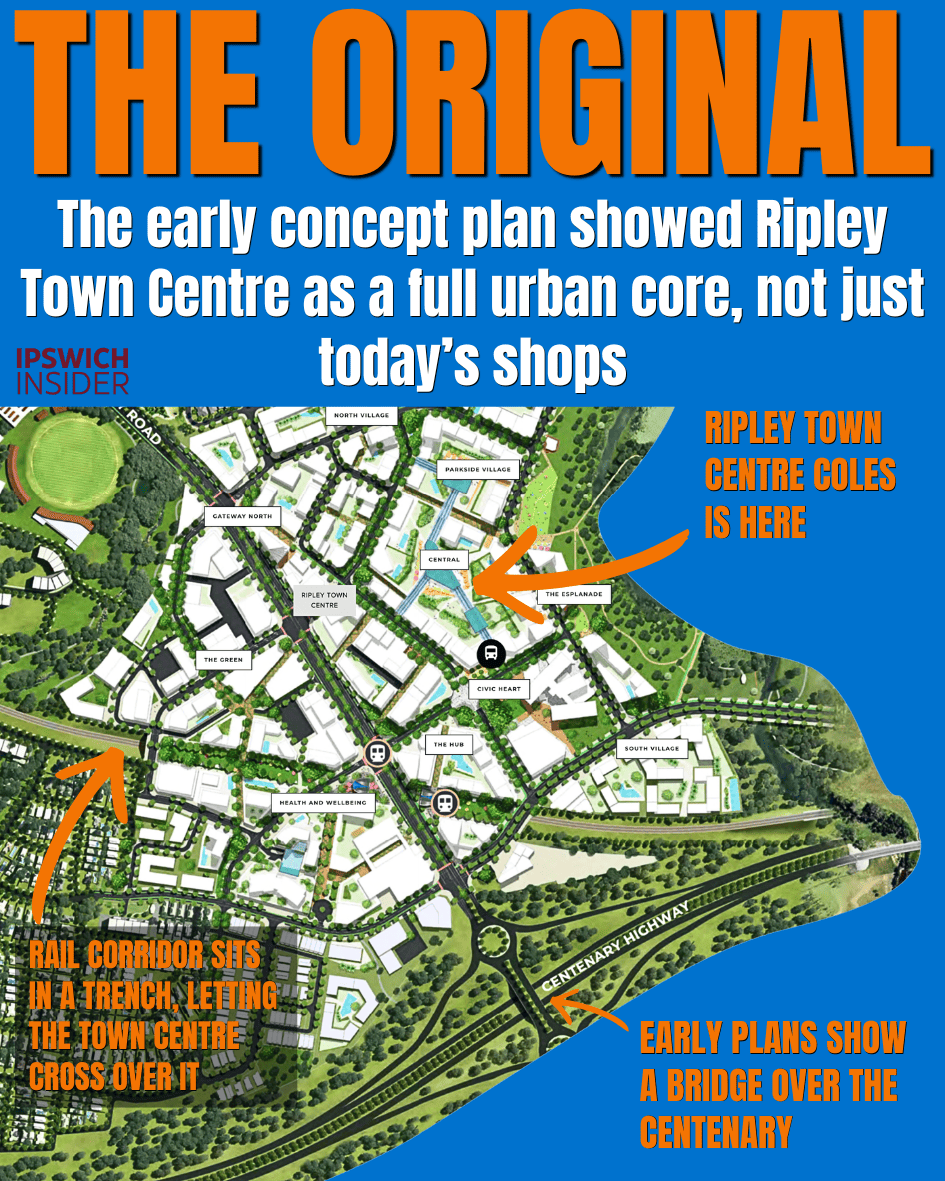
The early interactive concept went further than the current build suggests. The rail corridor was designed to sit in a trench (not a tunnel like Victoria Tunnel in Grandchester) beneath the town centre. Early plans also showed a bridge over the Centenary Motorway.
The Renders
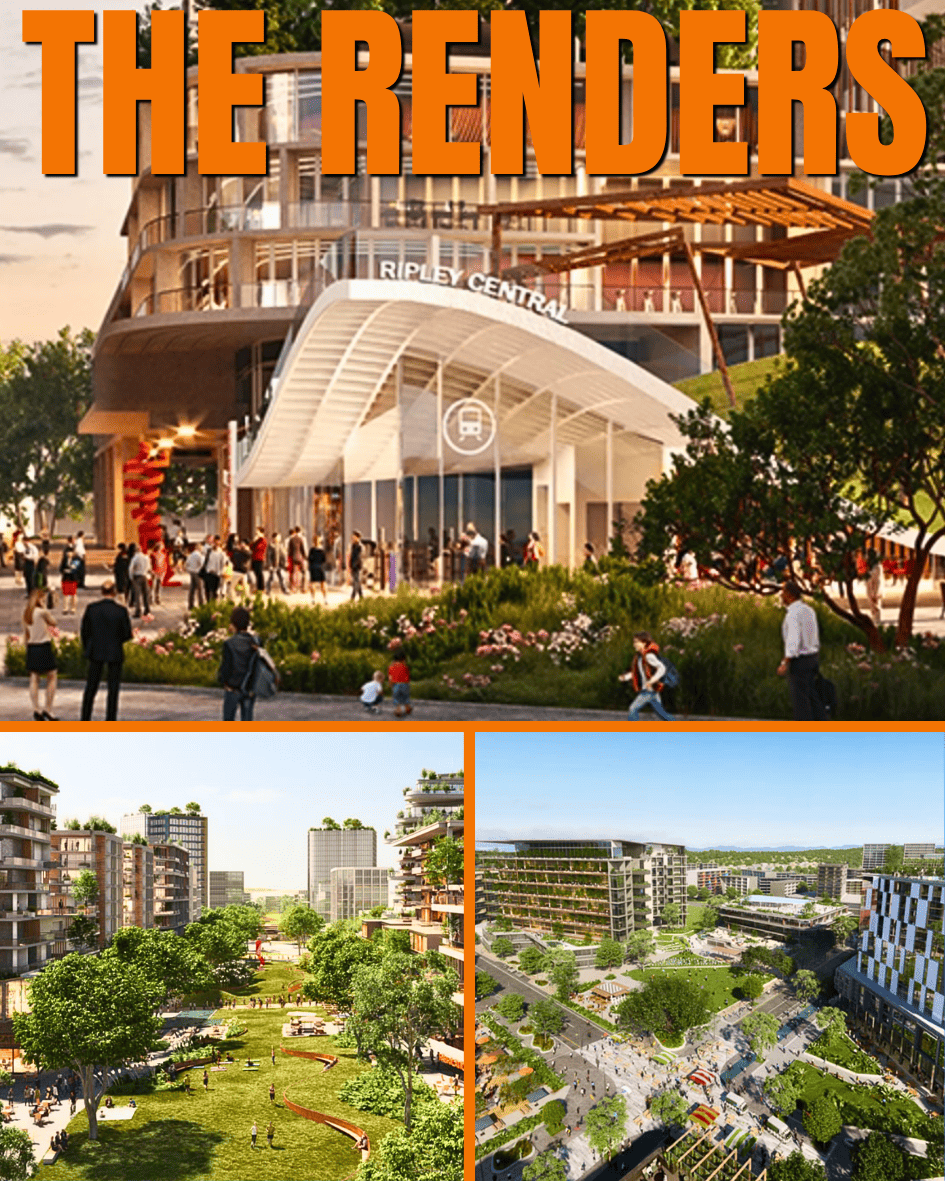
Promotional renders from the early Ripley Town Centre masterplan days
The Local Centres

Three Tiers Of Centres
The masterplan never imagined one giant centre and rooftops everywhere else.
It set out a centre hierarchy so daily needs sat inside walking distance of homes.
Urban core at the top.
Secondary centres below it.
Neighbourhood centres below those.
Three tiers, three jobs
- The urban core. Ripley Town Centre. The biggest. The densest. Highest order retail and services for the whole valley.
- Secondary centres. Providence Town Centre is the clearest example. Shopping, food, services, smaller scale retail. Designed to serve a sub area of the valley, not the whole thing.
- Neighbourhood centres. Daily needs scale. Local shops, cafes, public transport stops, community uses. Generally on collector roads with good walk and cycle access.
- Five minute walks. The scheme says each neighbourhood should be organised around a focal point within a five minute walk. A park, a transport stop, a community facility or a local shop. That’s the planning principle.
- Indicative, not exact. The centre dots on the structure plan are a framework, not a promise. Exact locations get resolved through context planning as each part of the valley gets built out.
Providence In Practice
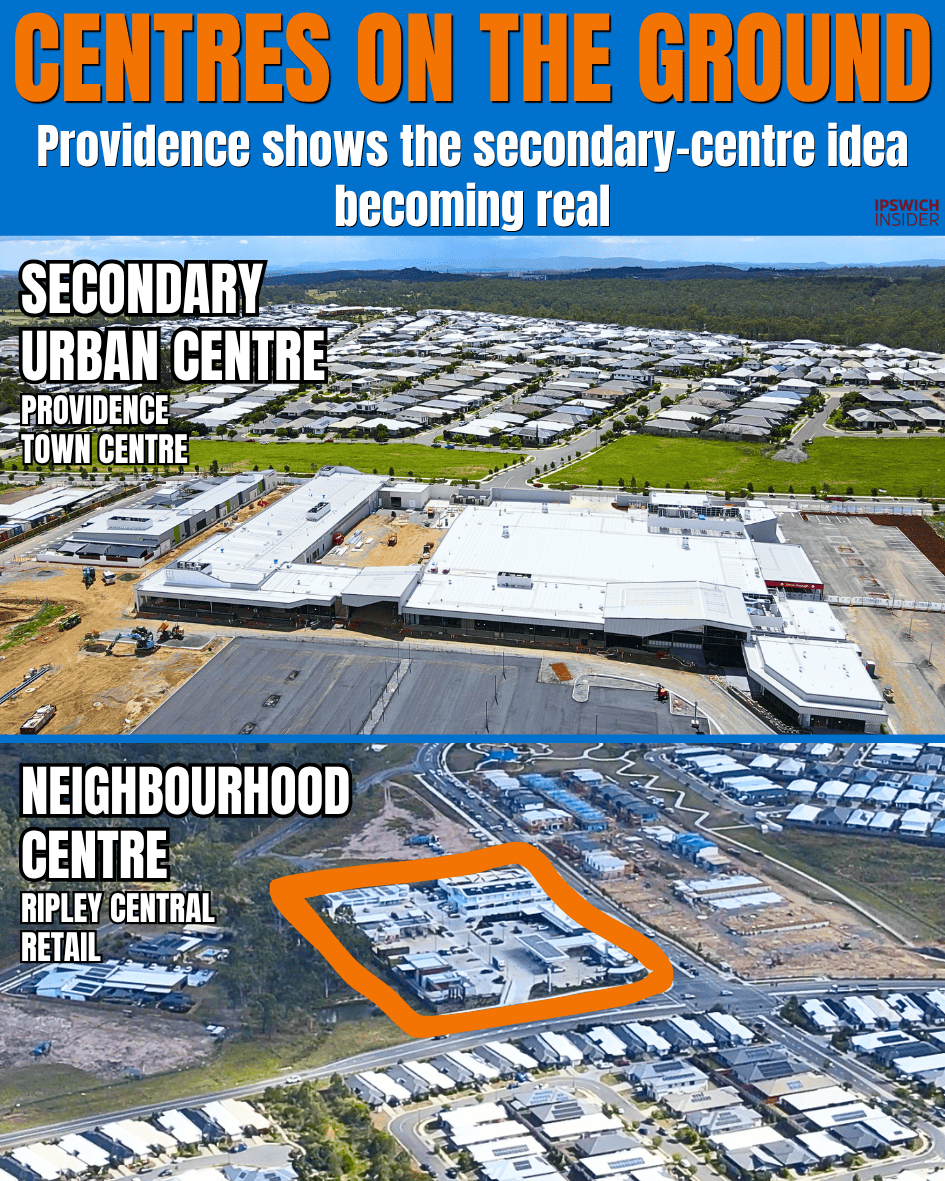
Providence Town Centre is the secondary centre idea now coming onto the ground. A focal point for the southern half of the valley. It’s not a replica of Ripley Town Centre. It’s a step down in the hierarchy.
The masterplan wanted multiple centres at different scales, doing different jobs for different catchments.
Ripley Central Retail – the one with the Starbucks on Ripley Rd – that’s an example of an even smaller neighbourhood centre. Cafes, car wash, a few retail shops, child care etc. The hierarchy keeps stepping down as you move away from the core.
The Road Arteries
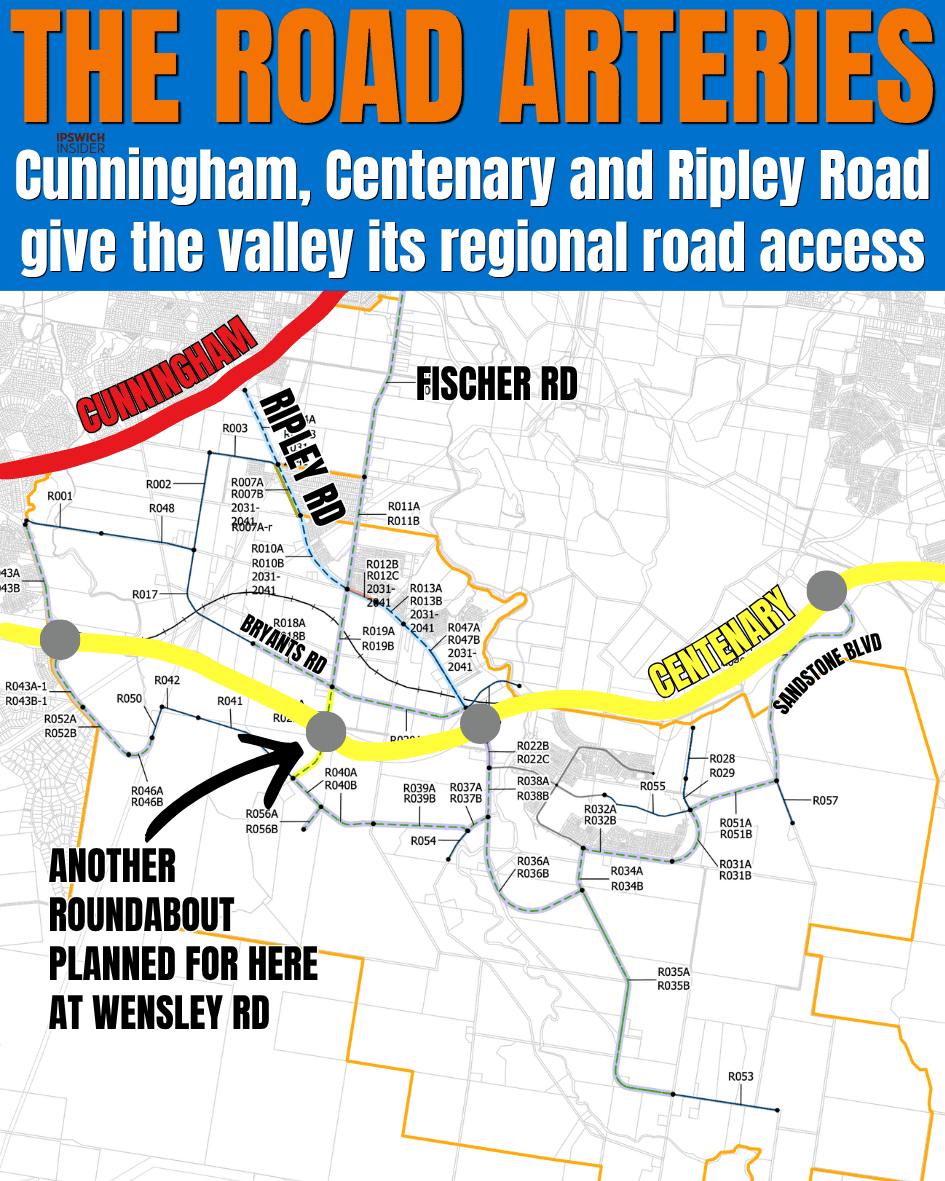
Three Roads Carry The Load
Cunningham. Centenary. Ripley Road.
The masterplan rests on three regional road corridors. They frame the PDA on the outside and connect it back to Ipswich, Springfield, Brisbane and beyond.
Why these three carry the load
- Cunningham Highway. Forms the northern boundary of the PDA. A key freight and inter regional route. Grade-separated interchanges at Redbank Plains Road north in Swanbank, and at Ripley Road.
- Centenary Motorway. What the 2011 scheme called the “Centenary Highway extension.” Bisects the PDA from east to west. The fast link to Springfield, Brisbane and the M2.
- Ripley Road. The valley’s main internal spine. Connects Cunningham at the top to South Ripley at the bottom. Much of the valley eventually feeds back to Ripley Road.
- A long sub regional upgrade list. The 2011 scheme planned a list of works: Centenary extension upgrade to Cunningham, Edwards Street extension, Ripley Road intersection upgrade, Ripley Road upgrade to Cunningham.
The Capillaries
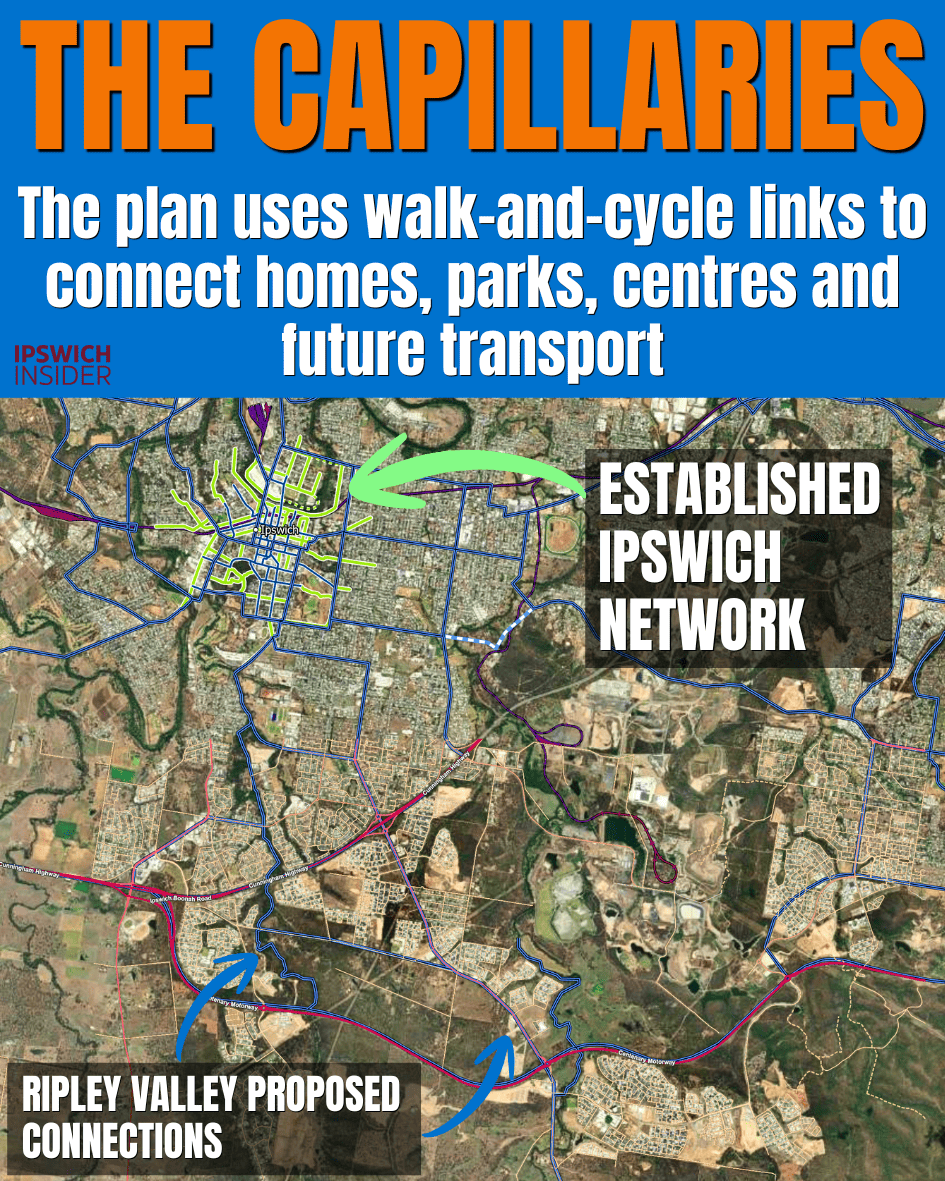
Five Minutes To A Stop
If the roads are arteries, the capillaries are the fine network of paths, footways and cycleways meant to weave through every neighbourhood.
Active transport was a priority in the masterplan.
You shouldn’t need to drive everywhere, right?
What the scheme actually required
- 400 metres to a stop. The 2011 scheme says 90% of dwellings should be within 400 metres of a potential public transport service. A five minute walk.
- Permeable streets. Neighbourhoods were to be compact, walkable and based on a highly permeable pattern of streets, parks and footpaths.
- Connected. Each neighbourhood had to provide good access to public transport, parks, schools, other facilities and centres.
The Centenary Stitch

A Highway Cuts Through
The 2011 development scheme says it plainly: the Centenary Highway extension “bisects the PDA”.
The motorway gives the valley regional access. But it also draws a hard line through the middle of the plan.
North side is Ripley and the urban core. South side is Providence and South Ripley.
The scheme called for multiple access routes and a comprehensive active transport network from the start, because the crossing problem was obvious from day one.
Getting between the two without a car was always going to need a grade-separated active transport crossing — a bridge or underpass across the motorway.
TMR has now funded $1 million for active transport crossing planning along the Centenary Motorway corridor. The Ripley Road and Centenary roundabout is the clearest example. Sandstone Boulevard and Wesley Way is the other obvious local pinch point. Funded for planning. Not for building.
The Small Block Pattern

Small Blocks By Design
Everyone asks,
“Why are the blocks so close together in Ripley? They have all that space, why not spread it out a bit?”
Well the answer is: the 2011 scheme baked higher densities, mixed dwelling types and a compact urban form into the rulebook. Small blocks are a design choice.
How density got built into the rules
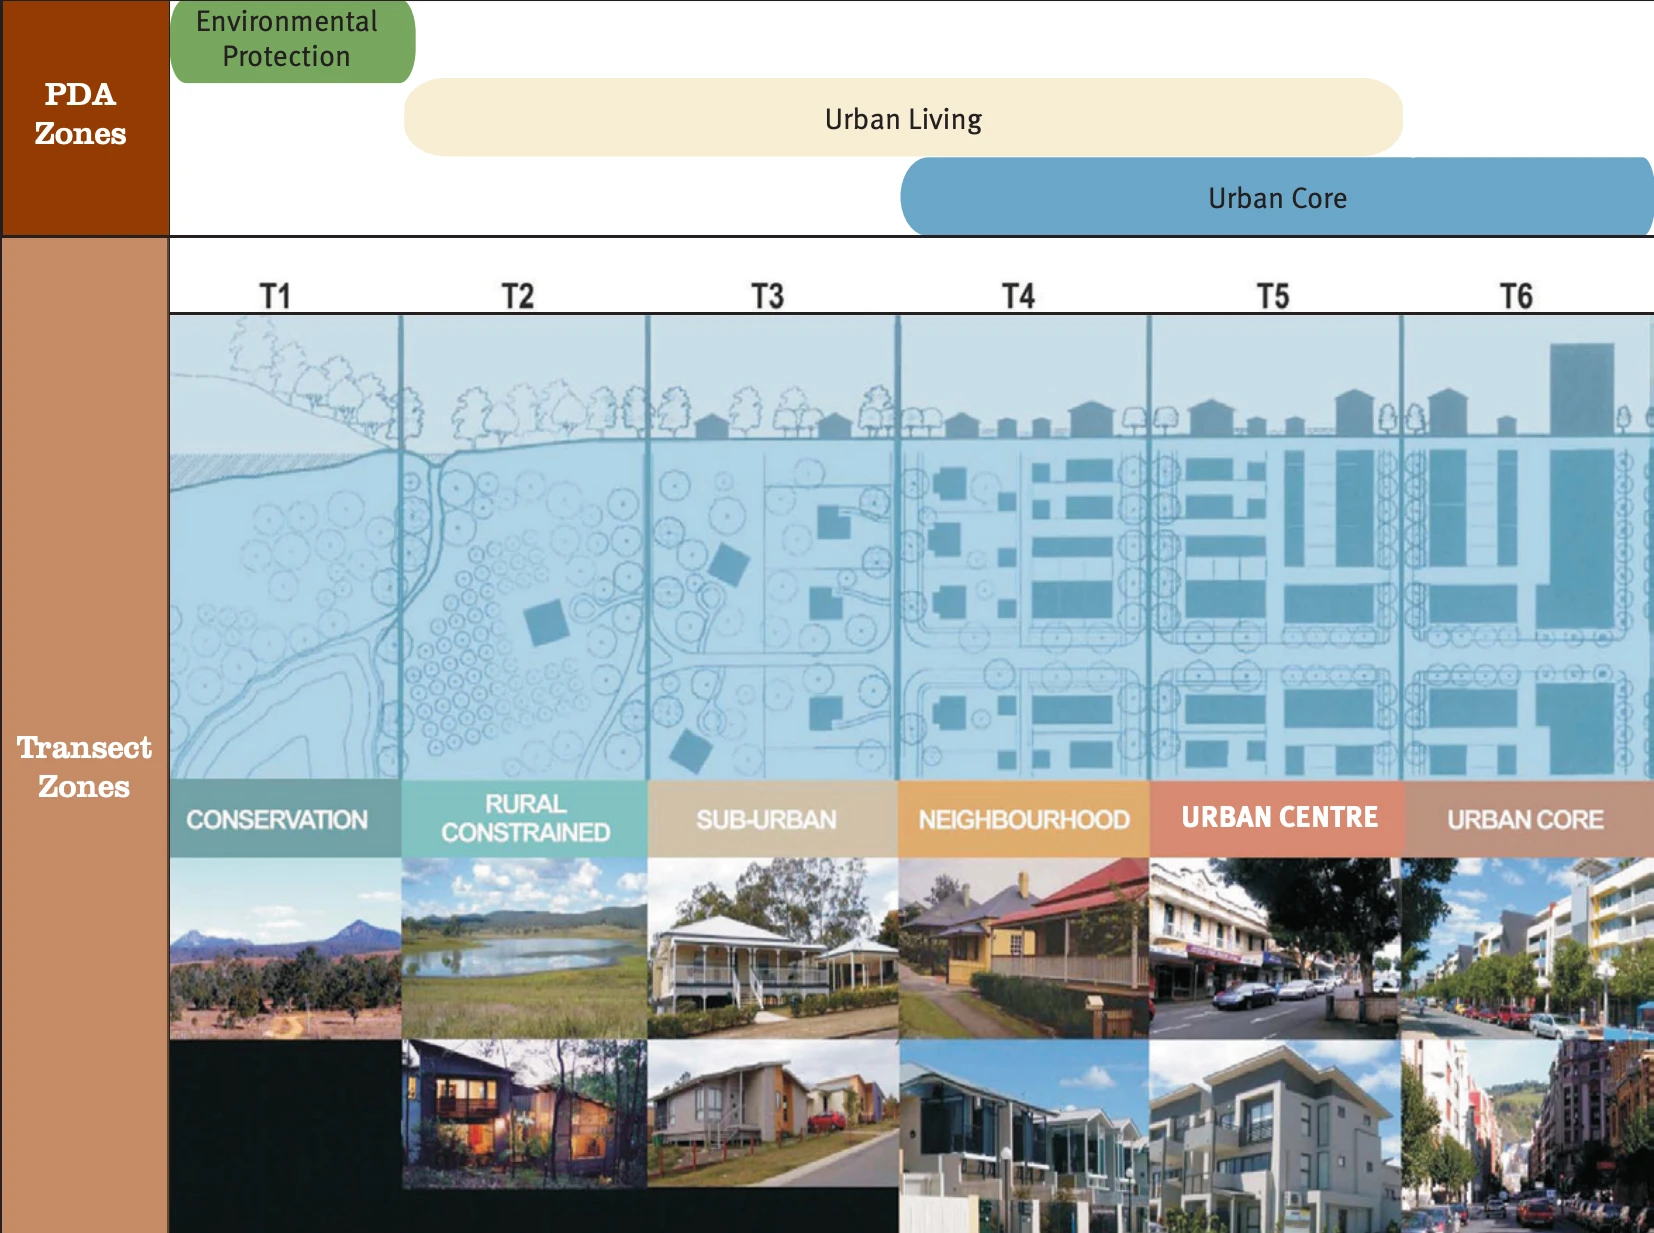
Relationship between TND Transect zones and PDA zones.
- The urban core: 50 to 100 dwellings per hectare. The densest part of the valley. Apartments. Mixed use. Buildings up to 12 storeys.
- The urban core frame: 20 to 50 dwellings per hectare. The scheme describes this as everything from small precincts of houses to multi-level apartment buildings, with density rising as you get closer to the centre.
- Secondary centres: 20 to 50 dwellings per hectare. Areas around Providence Town Centre sit in this band.
- Mixed dwelling types required. The scheme says Ripley is to provide a range of lot sizes, housing densities, housing choices and tenures.
- Why this matters. The compact form means more people per hectare. More street activity. More demand for local services. Closer trips. Whether the buildout actually delivers what the scheme allowed for is a separate question. The allowance is there.
The Guts
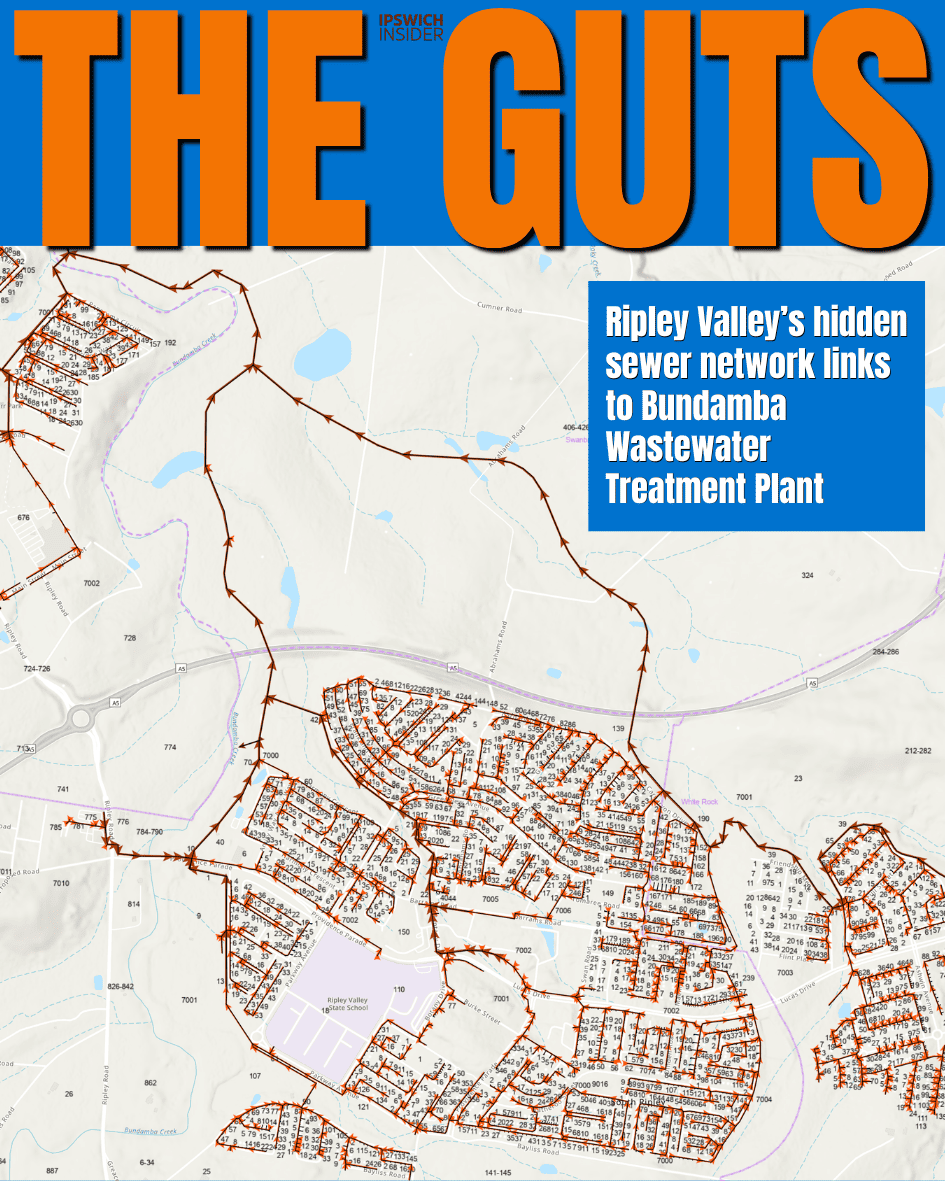
Pipes Before Houses
You can’t build 48,750 homes without somewhere for the wastewater to go.
The masterplan didn’t ignore this. Obviously.
It planned a trunk sewer network running through the valley, all feeding back to the Bundamba Wastewater Treatment Plant.
Why sewer shapes the build order
- The simple version: Ripley Valley sits in the Bundamba trunk sewerage catchment. Sewage generated in the catchment is conveyed to Bundamba Sewage Treatment Plant, with the PDA split between Deebing Creek and Bundamba Creek sewer catchments.
- Trunk first, then estates. Developers can’t just start building anywhere. The trunk sewer mains have to reach the site first.
- The state plans the trunk. Developers plug in. The infrastructure framework sets out trunk routes and timing. Each estate connects in as its part of the valley becomes serviced.
- Capacity is finite. Bundamba WWTP has a planned capacity. As the valley fills, that capacity has to grow with it. Plant upgrades are part of the long term infrastructure picture for the masterplan.
The Lungs

The Land Drew The Lines
Look at the masterplan and the green patches look like parks.
They’re not. Not always.
Sometimes that green is a flood line. Sometimes a slope steeper than 15%. Sometimes a bushfire constraint. Sometimes an ecological corridor. The land itself drew most of those lines before any planner did.
How the land shaped the plan
- Bundamba and Deebing Creek. Bundamba drains the central and eastern parts of the valley. Deebing drains the western part. Their banks and tributaries became open space corridors in the plan.
- Slope above 15%. Steep ground was mapped as a development constraint. (Side note: You think 15% is steep? Check out Ipswich’s steepest streets.)
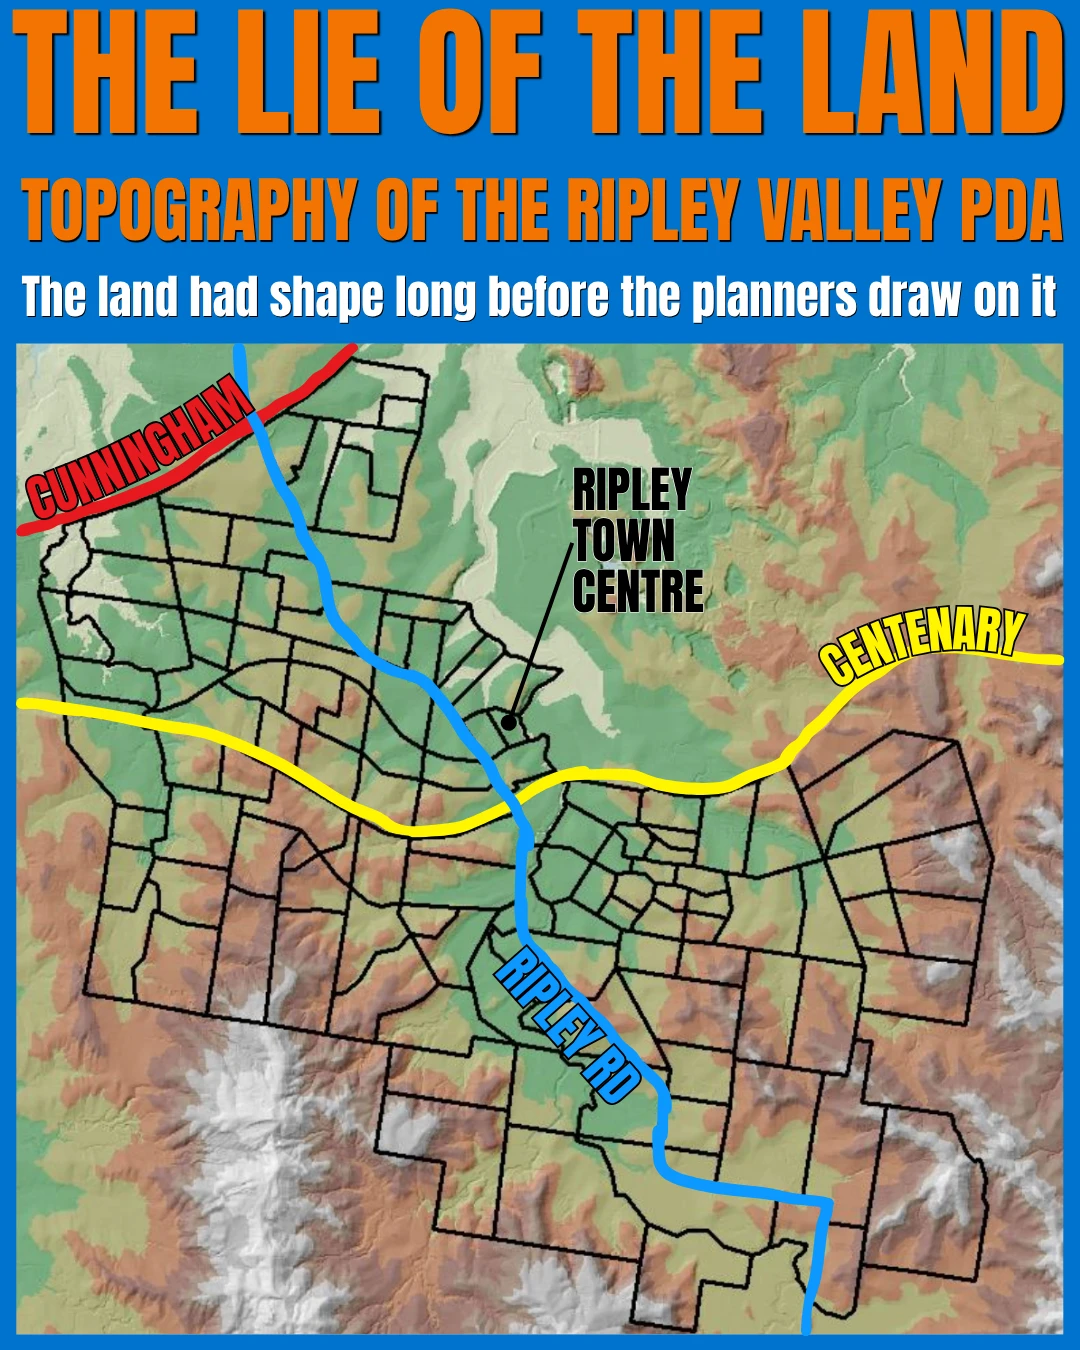
- Bushfire and flooding. Both constrain where housing can go. The scheme explicitly says urban zoning doesn’t override these constraints.
- Riparian corridors, ridgelines, habitat. All identified on the Values map. All factored into the structure plan before any houses got drawn.
- What this means when you read the masterplan. When you see a green patch on the plan, it isn’t always a park or Conservation Estate. Sometimes it’s an ecological corridor. Sometimes a flood line. Sometimes a steep slope.
The green isn’t always amenity. Sometimes it’s a hard “no” from the land itself.
The Jobs Footprint
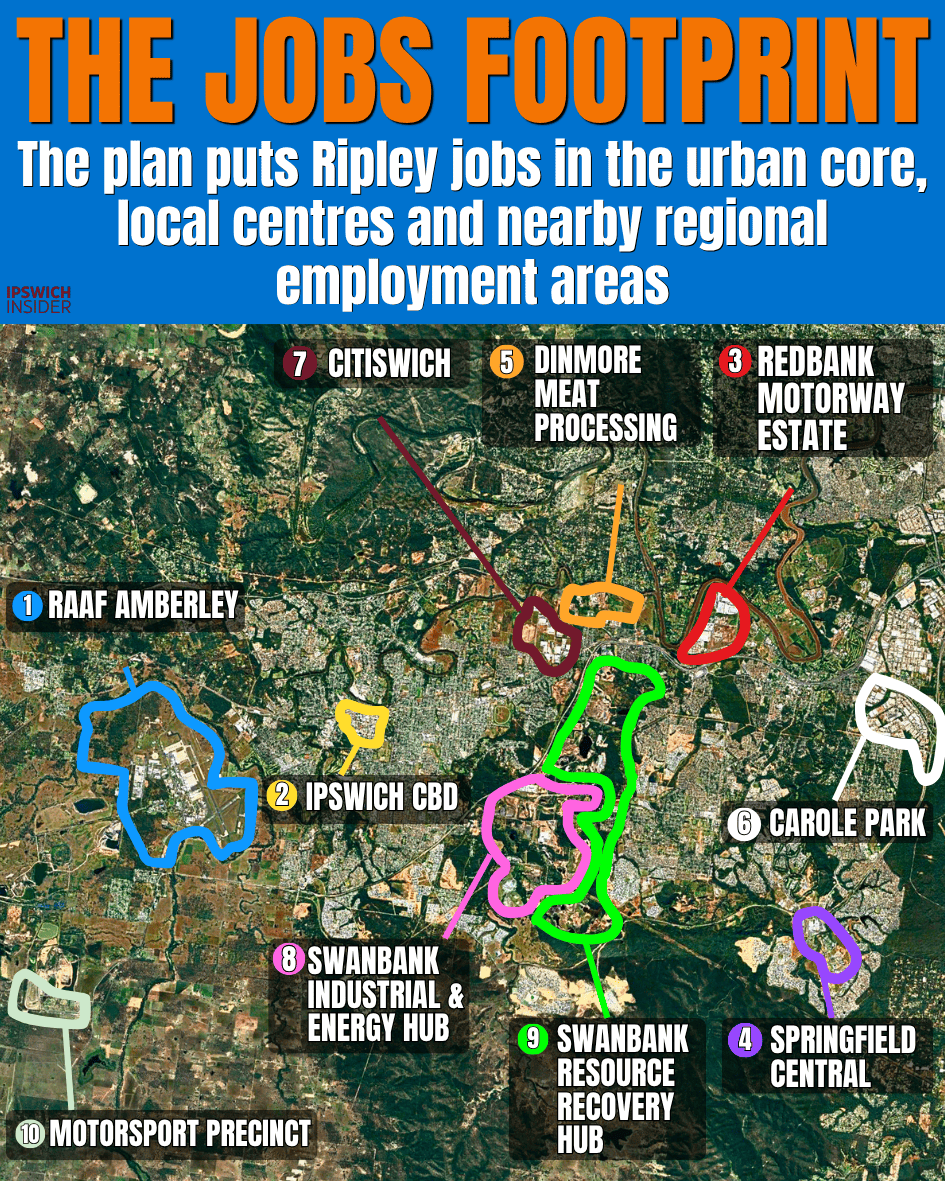
A Network, Not A Precinct
Ripley was never planned as a pure commuter suburb.
It was never planned as an industrial precinct either.
The masterplan does something in between: it spreads jobs across the centre hierarchy inside the valley, and leans on the major employers already sitting around it.
How the jobs picture was supposed to work
- Jobs in the centres. The urban core was meant to be the biggest employer. Offices. Services. Health. Education. Retail. The secondary centres pick up the rest.
- Service and business land. The scheme contemplates low impact industry, service industry, research and technology uses, and warehouses. Generally in flexible employment areas attached to centres.
- No designated industrial precinct. The 2011 scheme says local industry and business areas had not been designated and would need further detailed planning.
- Big nearby employers carry a lot of the load. RAAF Amberley. Ipswich CBD. Swanbank. Citiswich. Springfield Central. Dinmore Meat Processing. Redbank Motorway Estate. Carole Park. All outside the PDA. All inside daily commute range.
- Why this is honest. The scheme promised local jobs plus access to a bigger regional jobs market.
The Promise Gap
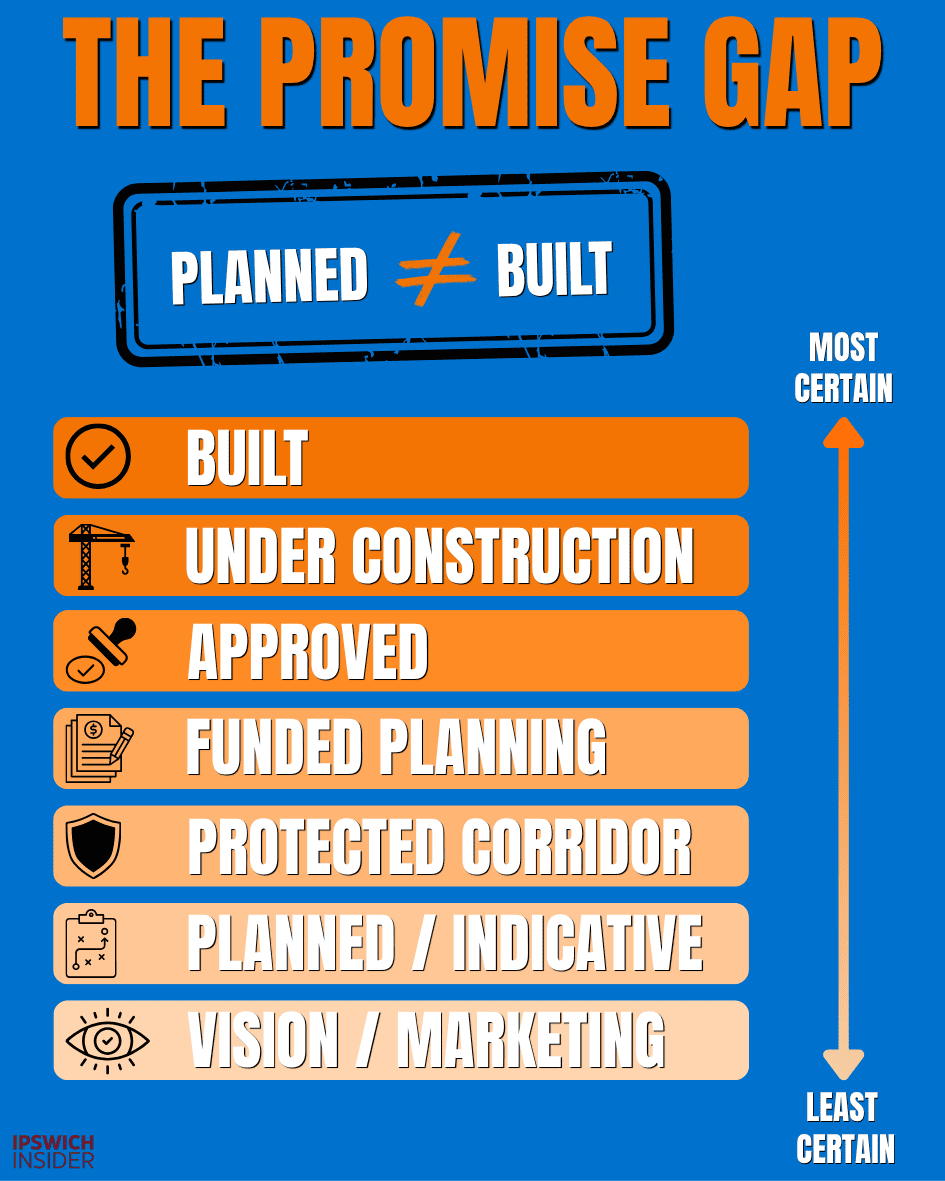
Planned ≠ Built
A masterplan is a stack of different commitments.
Some are built.
Some are funded.
Some are protected.
Some are just glossy renders.
They all sit inside the same document.
That’s why people get confused about what’s real and what’s not.
The certainty ladder, applied to Ripley
- Built. Done. On the ground. You can drive on it, walk into it, live in it. Cunningham Highway. Centenary Motorway. Ripley Road. Stage 1 of Ripley Town Centre. Providence. The schools.
- Under construction. Active sites. Cranes. Concrete. Several Ripley estates sit here right now.
- Approved. Has development approval. Not yet built. Ripley Town Centre Stage 2 sits here as of March 2026.
- Funded planning. Money committed for design and business case work. Not for construction. The active transport crossing at the Centenary roundabout sits here. The next stage corridor planning sits here.
- Protected corridor. Land kept clear for a future use. No buildings on it. No funding to build the use itself. The Ipswich-Springfield public transport corridor sits here. Protected since 2007.
- Planned / indicative. Shown on a structure plan map. Not legally locked in. Future neighbourhood centre locations sit here. Proposed station locations sit here.
- Vision / marketing. Renders. Brochures. Aspirational targets. The 2011 scheme’s stretch goals like 20% active transport mode share by 2016, zero-emission private vehicles, and no-net-greenhouse-gas new buildings sit here. Beautiful. Not binding.
Sources
- Ripley Valley – edq.qld.gov.au
- Ripley Valley PDA Development Scheme Amendment No. 2 (PDF) – edq.qld.gov.au
- Ripley Valley Urban Development Area Development Scheme October 2011 (PDF) – edq.qld.gov.au
- Ripley Valley Infrastructure Planning and Background Report (PDF) – edq.qld.gov.au
- Ripley Valley Assessment Process – ipswich.qld.gov.au
- Ipswich to Springfield Public Transport Corridor Study – tmr.qld.gov.au
- Centenary Motorway (Darra-Yamanto), planning – tmr.qld.gov.au
- Ripley Town Centre – ripleytowncentre.com.au
- Providence – stockland.com.au
- Ripley Town Centre Living, QLD – sekisuihouse.com.au
- Ecco Ripley – sekisuihouse.com.au