
Ipswich Wastewater at a Glance:
- Network: The underground grid spans 1,600km—only 29km less than Ipswich to Melbourne. To overcome our hilly terrain, 339 pump stations force-feed waste uphill to treatment plants 24/7.
- Volume: The system processes over 51 million litres per day at key sites like Bundamba and Goodna. That’s the same as draining 17 Orion Lagoons every day. This load is projected to surge as 131,000 residents pour into Ripley Valley in the next 15 years.
- Technology: Goodna uses modern tech called Membrane Bioreactors (MBR). With pores 100x smaller than a human hair. This advanced filtration physically blocks bacteria and viruses. Allowing the facility to discharge high-quality water without heavy chemical dosing.
🔢 By The Numbers

- 1,600 km – Length of sewer pipes buried beneath Ipswich
- 51 Million – Litres of wastewater processed daily for Ipswich
- 339 – SEQ pump stations pushing waste uphill 24/7
- $6 Billion – Value of the total SEQ water asset network
- 180,000 – People capacity of the Bundamba Treatment Plant
- 100x – How much smaller membrane pores are than a human hair at Goodna STP
- 975 L/s – Pumping speed of Ipswich’s biggest station (SP331)
- 131,000 – Future residents expected in the Ripley Valley corridor
- $115 Million – Cost of the massive Goodna plant upgrade
- 1500mm – Diameter of the largest interceptor pipes
- $400 Million – Amount spent fixing infrastructure yearly by Urban Utilities
- 100% – Percentage of the network owned by local councils
Flush, drain, disappear.
It is the ultimate illusion.
We pull the plug, and the water vanishes. But where exactly does it go?
A treatment plant, yes. But how does it get there?
Here is the reality: Because of our city’s steep hills, that waste doesn’t just flow away—it has to be fought.
Buried beneath your feet is a high-pressure mechanical world battling gravity 24 hours a day to keep the network from backing up into your home. It is the most complex machine you rely on, yet you have never seen it.
Until now.
Today, we take a look inside Ipswich’s wastewater world. The pumps, the pipes, and the plants.
Let’s go.
More Ipswich Gems:
System At A Glance

Details
How many treatment plants does Ipswich have?
- 2 large: Bundamba + Goodna
- 1 medium: Carole Park
- 3 small: Rosewood, RAAF, Borallon Prison
How many pumping stations?
- ~50 inside Ipswich
- ~339 across the Urban Utilities SEQ service area
How long is the pipe network?
- ~1,600 km of sewer pipes
- ~1,800 km of water pipes
Biggest Treatment Plants

Details
Which sewage treatment plants are biggest (by approximate people capacity)?
- Bundamba: ~180,000 people
- Goodna: ~85,000 people
- Carole Park (Ellen Grove): ~30,000 people
- Rosewood: ~4,000 people
- RAAF Amberley: ~4,000 people
- Borallon Prison: ~1,400 people
What does “capacity” mean?
- It’s a simple “people equivalent” style comparison. Bigger number = bigger treatment load.
Plant Anatomy
Details
What are the main parts of a wastewater plant (as labelled)?
- Inlet works & screens
- Fine screens + chemicals
- Primary clarifiers + sediment tanks
- Secondary clarifiers (shown more than once on the aerial)
- Old bioreactors
- New plant: membrane bioreactors
- Odour control unit
- Sludge thickeners
- Anaerobic digester
- Sludge dewatering building
- Tertiary filters / sand filters
- Filter control room
- Admin
- Solar array
Which plant is pictured?
- Pictured is the Goodna sewage treatment plant.
Bundamba WWTP
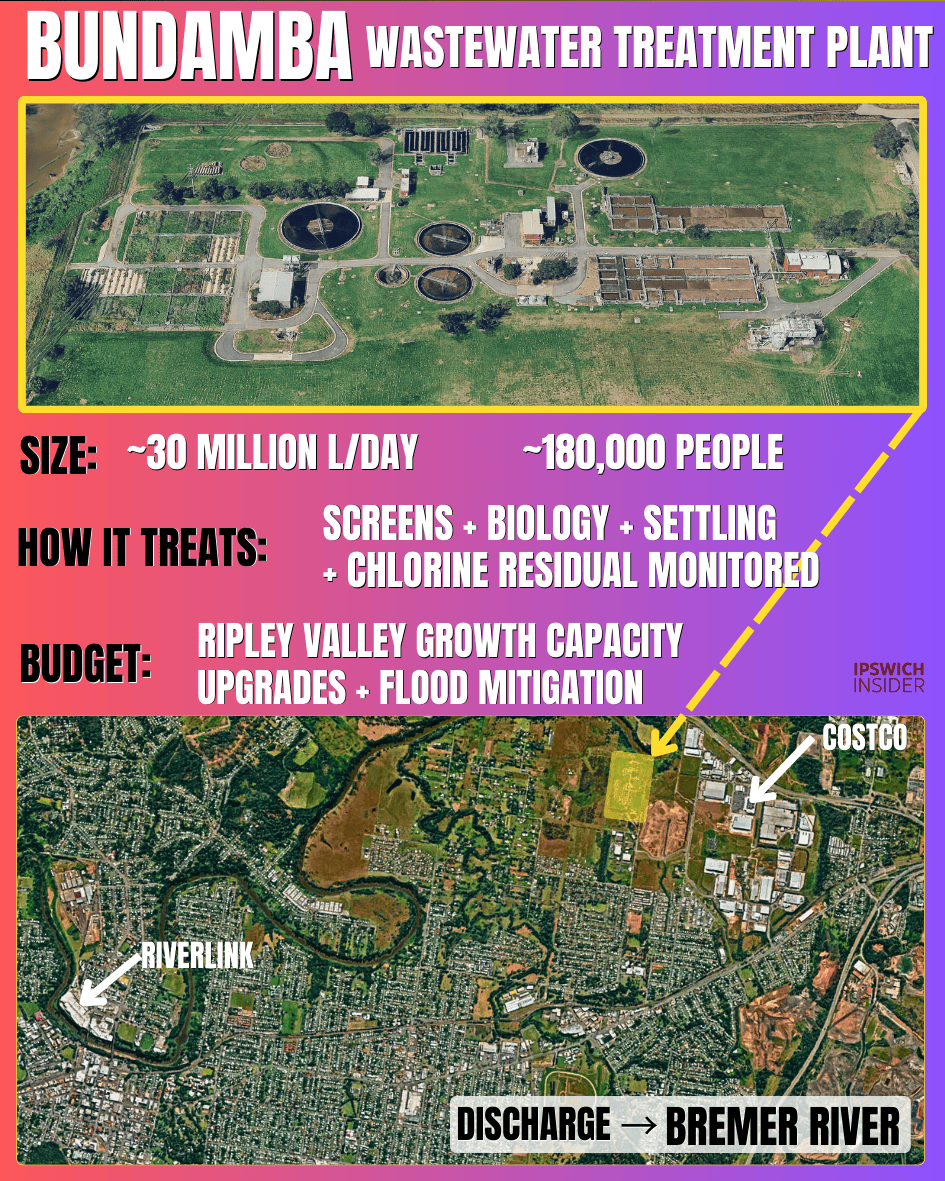
Details
How big is Bundamba?
- Size: ~30 million L/day
- Capacity: ~180,000 people
How does it treat wastewater (one-line version)?
- Screens + biology + settling, with chlorine residual monitored
What is in the current budget?
- Ripley Valley growth capacity upgrades + flood mitigation
Where does it discharge?
- Bremer River
Goodna STP
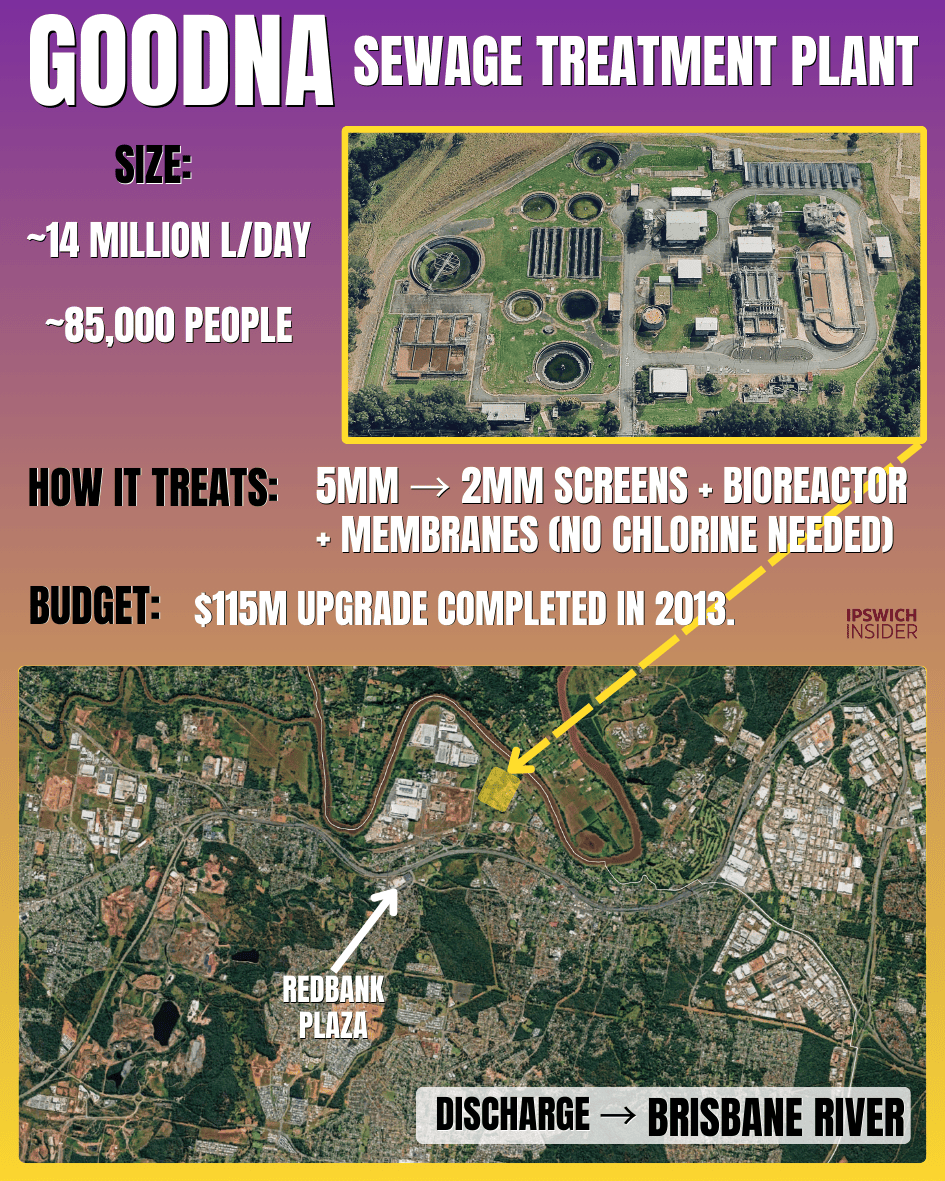
Details
How big is Goodna?
- Size: ~14 million L/day
- Capacity: ~85,000 people
How does it treat wastewater (one-line version)?
- 5mm → 2mm screens + bioreactor + membranes (no chlorine needed)
What is in the budget?
- Budget: $115M upgrade completed in 2013
Where does it discharge?
- Brisbane River
Carole Park STP

Details
Where is it located and what does it mainly treat?
- Located in: Ellen Grove
- Primarily treating: Carole Park + Ellen Grove
How big is Carole Park?
- Size: ~4 million L/day
- Equivalent capacity: ~30,000 people
How does it treat wastewater (one-line version)?
- Biological treatment + chlorine residual monitored
What is in the budget?
- Budget: $10M+ upgrades on the books
Where does it discharge?
- Brisbane River
Rosewood STP

Details
How big is Rosewood?
- Size: ~0.6M L/day
- Equivalent capacity: ~4,000 people
How does it treat wastewater (one-line version)?
- Treated effluent + chlorine residual monitored before Western Creek release
What is in the budget pipeline?
- Budget: $40M earmarked for major growth upgrades
Where does it discharge?
- Western Creek
- Land (on-site)
Biggest Pump Stations

Details
Which Ipswich pump stations are the biggest (max capacity)?
- SP331: 975 L/s — Lobley St, Ipswich
- SP322: 833 L/s — Hanlon St, Bundamba
- SP351: 780 L/s — Tantivy St, Tivoli
- SP322: 727 L/s — Briggs Rd, Flinders View
- SP384: 538 L/s — Nevis St, Ripley
Why do some pump stations look “taller”?
- Some pump stations have their electrical equipment raised above flood peaks.
Pump Station Anatomy

Details
What’s above ground on this “new school” pump station?
- Mains
- Transfer switch
- “Soft starters”
- Distribution board
- Backup power
- “Brains” (controls)
What’s underground?
- Motors + pumps are underground (in the wet well area).
Why is it built high?
- Key gear is positioned above flood levels.
How are pumps removed for maintenance?
- A lifting gantry is used for pumps/motors.
Pump Station Jobs
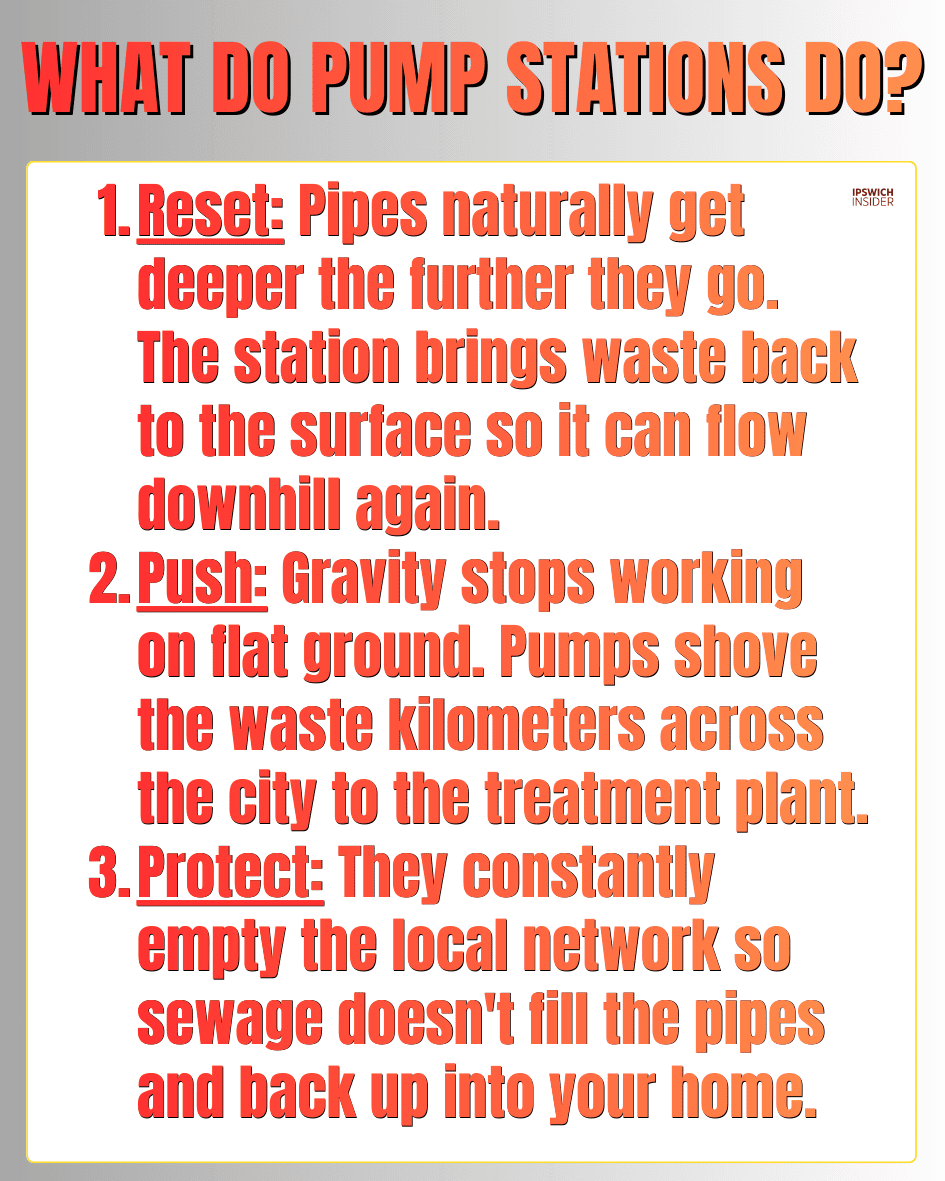
Details
Reset: what does that mean?
- Pipes naturally get deeper the further they go.
- The station brings waste back to the surface so it can flow downhill again.
Push: when does gravity stop helping?
- Gravity stops working on flat ground.
- Pumps shove the waste kilometres across the city to the treatment plant.
Protect: what are pump stations preventing?
- They constantly empty the local network so sewage doesn’t fill the pipes and back up into your home.
Sewer Piping Network

Details
How long is Ipswich’s sewer piping network?
- 1,600+ km of sewer pipes
Which areas are highlighted on the maps?
- Ipswich Central Area
- Redbank Plains Area (DN600)
- Brassall + Woodend Area
- Rosewood Area
What’s the data source?
- Urban Utilities Open Data Map
Pipe Types

Details
What pipe is typically used for a house connection?
- House connection: 100mm PVC
What is a street main?
- Diameter: 150–300mm
- Purpose: carry a street’s sewage to the local main
What is a local trunk main?
- Diameter: 600mm
- Purpose: carry a suburb’s sewage to the interceptor
What is an interceptor main?
- Diameter: 1200–1500mm
- Purpose: carry multiple suburbs’ sewage towards the treatment plant
Final Push

Details
Does sewage arrive steadily at a plant?
- The Pulse: sewage doesn’t trickle, it surges.
- Pumps shove waste in batches, arriving at the plant like a heartbeat.
What does a “stilling wall” do?
- The Calm: a concrete stilling wall instantly kills velocity.
- It turns a firehose blast into a slow, treatable river.
What happens in a clarifier settling tank?
- The diagram shows an inlet zone, settling zone, outlet zone, and sludge zone.
Where does the flow go after this step?
- To further treatment
- To sludge lagoons (for solids handling)
- Eventually towards the river after treatment
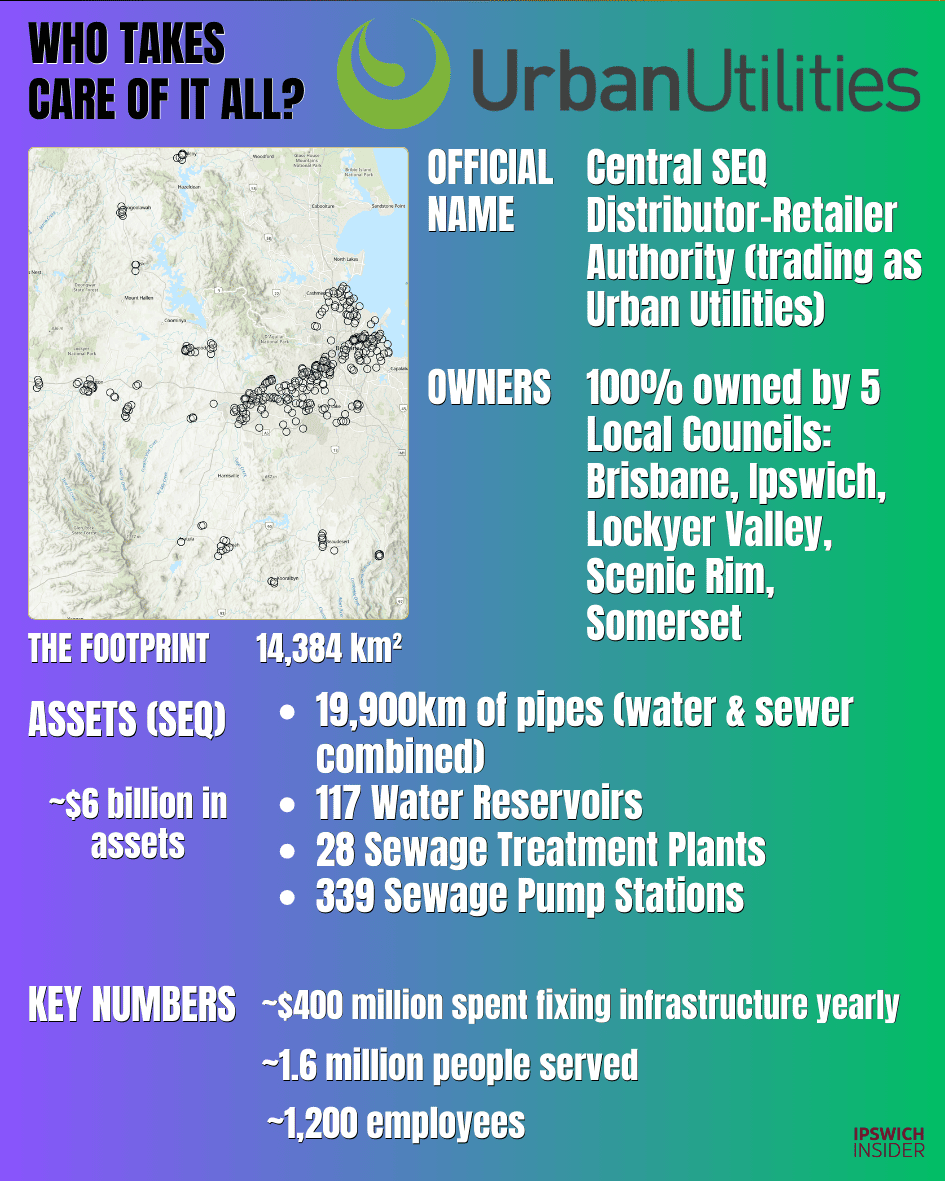
Who Runs It
Details
What is the official name?
- Central SEQ Distributor-Retailer Authority (trading as Urban Utilities)
Who owns it?
- 100% owned by 5 local councils: Brisbane, Ipswich, Lockyer Valley, Scenic Rim, Somerset
How big is the footprint?
- 14,384 km²
What assets are listed (SEQ)?
- ~$6 billion in assets
- 19,900km of pipes (water & sewer combined)
- 117 water reservoirs
- 28 sewage treatment plants
- 339 sewage pump stations
Key numbers
- ~$400 million spent fixing infrastructure yearly
- ~1.6 million people served
- ~1,200 employees
Sources
- Urban Utilities Open Data Map. https://quu.maps.arcgis.com/