

Ipswich’s Wildest Weather at a Glance
- Unbeaten rain record since 1974. 340 mm in a single day is still the all-time rain record over a 24-hour period. The next closest is 216.8 mm in 2022. And what a wild day that was.
- 49.5° swing. Ipswich has hit 44.6° and dropped to -4.9°. Its all-time low daily-high is 10.5°. Brisbane’s full range is only about 43° (2° to 41° in the CBD). Ipswich gets it from both ends.
- Two months cause the most chaos. February and December account for 6 of the 14 wildest days. April, May, June and September are the safest months with 0 wild weather events in our ranking system.
🔍 Quick Facts

- February and December share the top spot. 3 entries each.
- Sunday, Tuesday and Thursday are the danger days. 3 entries each. Friday has zero.
- 1995 gave us both extremes. The coldest morning (-4.9° in August) and the wildest wind (152 km/h in December). Winter and summer in the same year.
- 2016 doubled up on storm season. 3,000 lightning strikes in November and everything at once in December. Back to back months.
- 132 years apart. The oldest entry is 1893. The newest is 2025.
- The 8th, 15th and 26th each appear twice. The 26th brought 44.6° heat in December 1972 and a drowned CBD in February 2022.
- April, May, June and September are the safest. Not a single entry from any of them.
- Rain dominates. 5 of the 14 are rain days. Heat, cold and hail get 2 each. Wind, lightning and chaos get 1 each.
- The 2010s were brutal. 4 of the 14 entries come from that single decade.
We get some wild weather in Ipswich:
340 mm of rain in a day.
Hailstones the size of softballs.
152 km/h wind gusts. Cat 2 cyclone territory.
44.6° on Boxing Day.
-4.9° on a winter morning.
3,000 lightning strikes in a single afternoon.
We crunched the data to find the 14 days that stand above the rest.
Then we gave each a headline and styled the weather event like a front page newspaper from the day it happened.
Scroll through the cards then read the full breakdown underneath.
If you reckon we missed one, let us know.
First, let’s agree on how we pick these days.
How We Picked These 14 Days
- Editorial, not scientific. We found the days locals would call wild, then backed them with official records.
- Ipswich first. Every day had to be an Ipswich event, not a Brisbane story with Ipswich mentioned in passing.
- Two stations. All numbers come from BoM Climate Data Online using Ipswich (site 040101, from 1870) and Amberley AMO (site 040004, from 1941).
- Weather, not floods. We ranked the weather on the day, not what the river did a week later. The 2011 flood peak is a good example of what that rule cuts.
- Five buckets. The shortlist was built across extreme heat, extreme cold, extreme rain, severe storm and hail, and compound chaos days.
- What missed out. Flood peak days without standout same-day weather were cut. So were generic SEQ storms that only clipped Ipswich.
More Ipswich Gold
Jump to:
- 27 January 1974 — Rain
- 31 October 2020 — Hail
- 16 February 1893 — Rain
- 26 February 2022 — Rain
- 18 December 2016 — Chaos
- 19 November 2008 — Rain
- 11 December 1995 — Wind
- 10 March 2025 — Rain
- 26 December 1972 — Heat
- 8 November 2016 — Lightning
- 6 January 1994 — Heat
- 8 August 1995 — Cold
- 15 February 2018 — Hail
- 15 July 1945 — Cold
340 mm in a day — 27 January 1974 — Rain
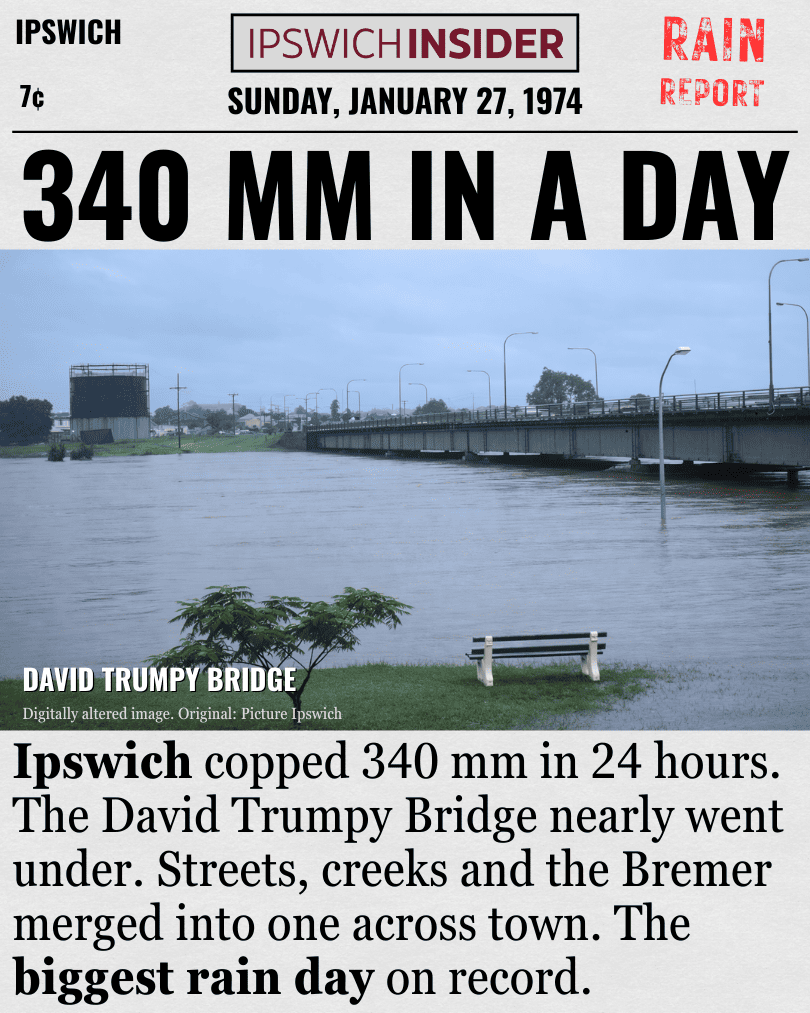
Original image source: Picture Ipswich
The biggest rain day in Ipswich’s recorded history
This is the biggest rain day in Ipswich’s recorded history. The city copped 340 mm in 24 hours. Amberley got 240 mm. The Bureau of Meteorology put the official figure at about 341 mm to 9 am.
Streets, creeks and the Bremer all merged into one. If this day is not at the top of any Ipswich weather list, the list is wrong.
Key Details
- Official total. The Bureau’s flood report records the 24-hour fall at Ipswich as about 341 mm to 9 am on 28 January.
- Region-wide. Amberley’s 240 mm reading shows the rain was heavy across the whole area, not just one pocket.
- Still unmatched. More than 50 years later, this is still the benchmark for extreme rainfall in Ipswich.
14 cm hail on Halloween — 31 October 2020 — Hail
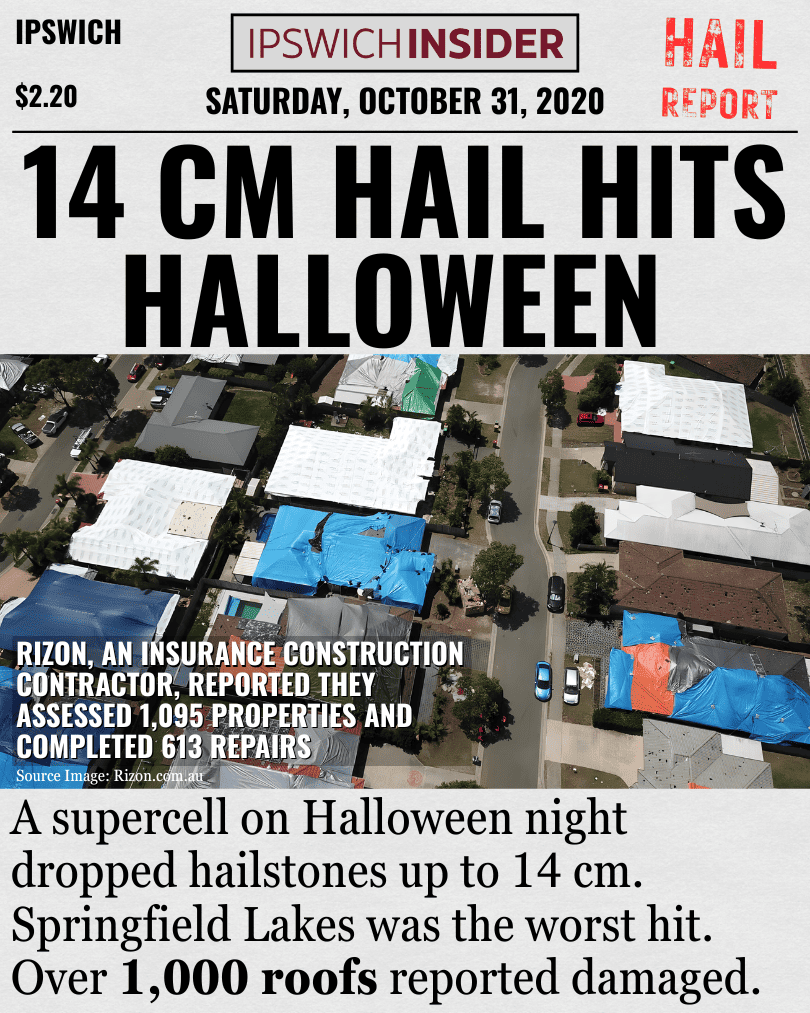
Original image source: Rizon
A supercell on Halloween night
A supercell storm tore through parts of Ipswich on Halloween night. Hailstones near Rosewood and Springfield Lakes measured up to 14 cm.
Roofs were punched through. Cars were written off. Some families could not move back into their homes for months. Ipswich gets storms every summer but rarely anything this damaging.
Key Details
- Size comparison. 14 cm is roughly the size of a softball. That is big enough to cause structural damage to homes.
- Insurance cost. Claims from the broader storm event ran into the hundreds of millions across south-east Queensland.
- Slow recovery. Some affected homes in the Ipswich area were still being repaired well into 2021.
Cyclone dumps 210 mm — 16 February 1893 — Rain
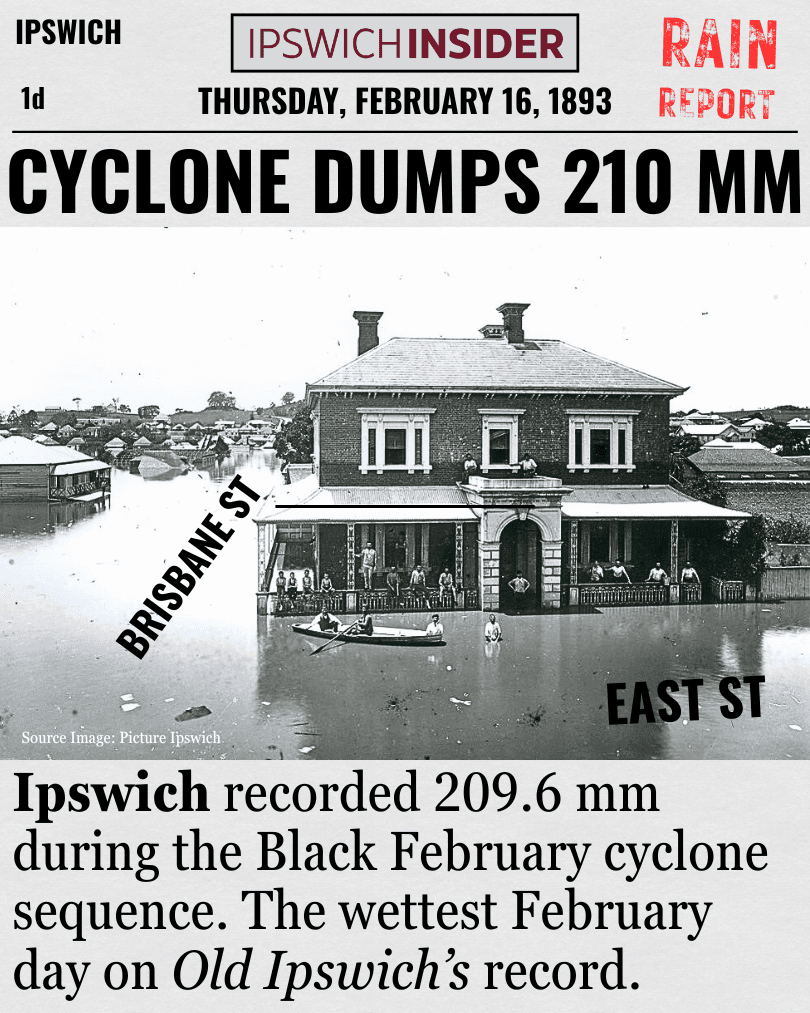
One of the biggest weather days in Ipswich history
No one alive today was around for this one. But the numbers still stand up. Ipswich recorded 209.6 mm. It is still the wettest February day on the city’s record.
The rain fell during the Black February cyclone sequence that battered south-east Queensland. One of the biggest weather days in Ipswich history.
Key Details
- Wider impact. The Black February sequence brought three separate flood peaks to the Brisbane River in a few weeks.
- Lasting legacy. The 1893 floods reshaped how south-east Queensland thought about river management and flood planning.
- Still standing. More than 130 years later, this daily total has not been beaten for February at the Ipswich site.
CBD goes under — 26 February 2022 — Rain
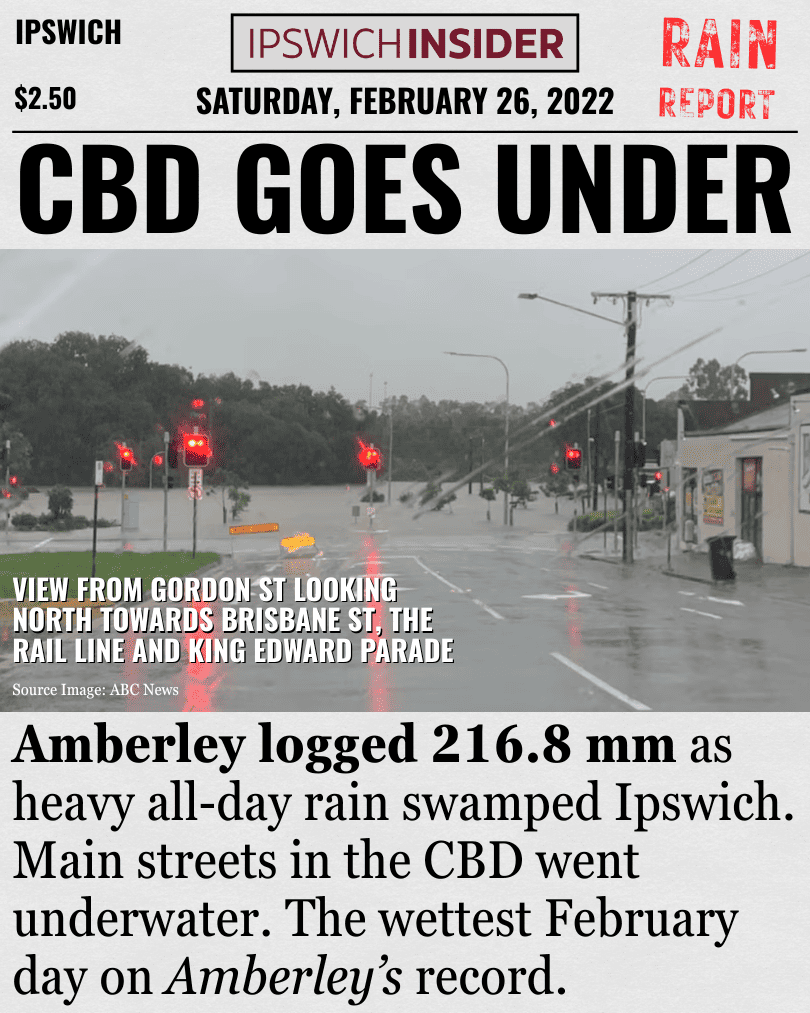
The rain day most locals would name first
This is probably the rain day most locals would name first. It was not a quick storm. It was heavy, wide, all-day rain falling on ground that was already soaked.
Amberley recorded 216.8 mm. That is its wettest February day on record. Main streets in the Ipswich CBD went underwater.
Key Details
- Already saturated. The ground was soaked from weeks of above-average rain before the main event hit.
- Record breaker. Amberley’s 216.8 mm broke its previous February daily record. It ranks among the station’s wettest days overall.
- Widespread damage. The flooding hit homes and businesses across multiple suburbs beyond just the CBD.
Everything at once — 18 December 2016 — Chaos
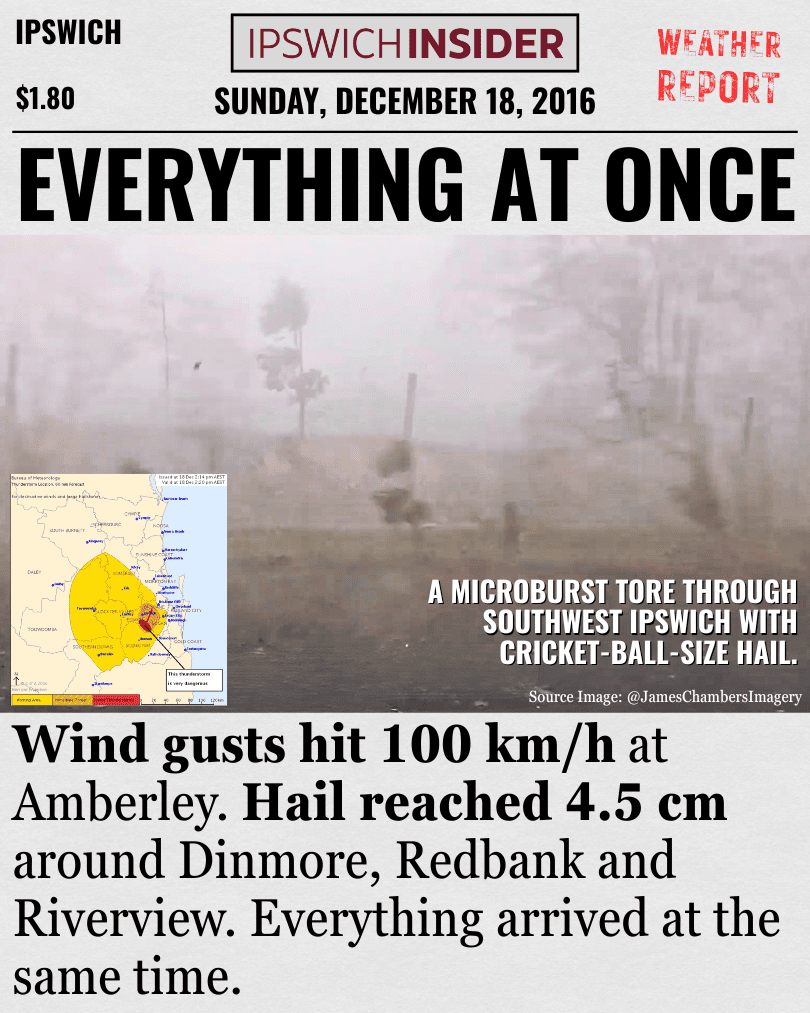
Hail, wind and rain all at once
This day threw everything at Ipswich. Amberley recorded wind gusts up to 100 km/h. The Bureau reported hail up to 4.5 cm around Dinmore, Redbank and Riverview.
It does not hold one single record. But as an all-round severe weather day it is hard to beat.
Key Details
- Hail size. 4.5 cm is roughly the size of a golf ball. Big enough to dent cars and crack roof tiles.
- Triple threat. Getting hail, wind and heavy rain in one event is unusual even by Ipswich storm standards.
- Storm corridor. Dinmore, Redbank and Riverview sit in a belt that often cops the worst of storms tracking through the area.
187 mm in 2 hours — 19 November 2008 — Rain
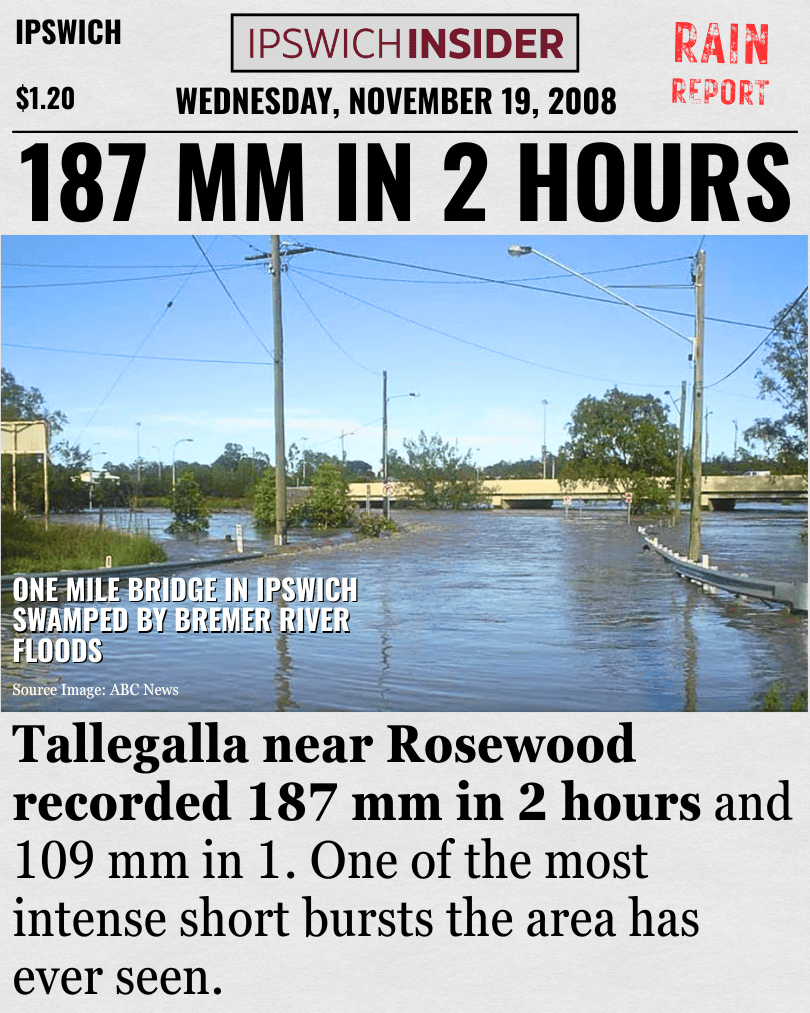
One of the most intense short bursts the area has seen
A storm hit the Ipswich to Toowoomba corridor and dumped rain at a rate you rarely see. Tallegalla near Rosewood recorded 187 mm in two hours and 109 mm in one hour.
The Bureau said hail was mixed in with the rain. There was wind damage as well. Few storm days in the Ipswich area can match that kind of intensity in such a short window.
Key Details
- Extreme rate. 109 mm in a single hour is a rain rate that most drainage systems are not built to handle.
- Wide path. The storm tracked along the Ipswich to Toowoomba corridor, hitting multiple towns along the way.
- Mixed hazards. Hail embedded in the rain made the storm more destructive than the rainfall alone would suggest.
Winds hit 152 km/h — 11 December 1995 — Wind
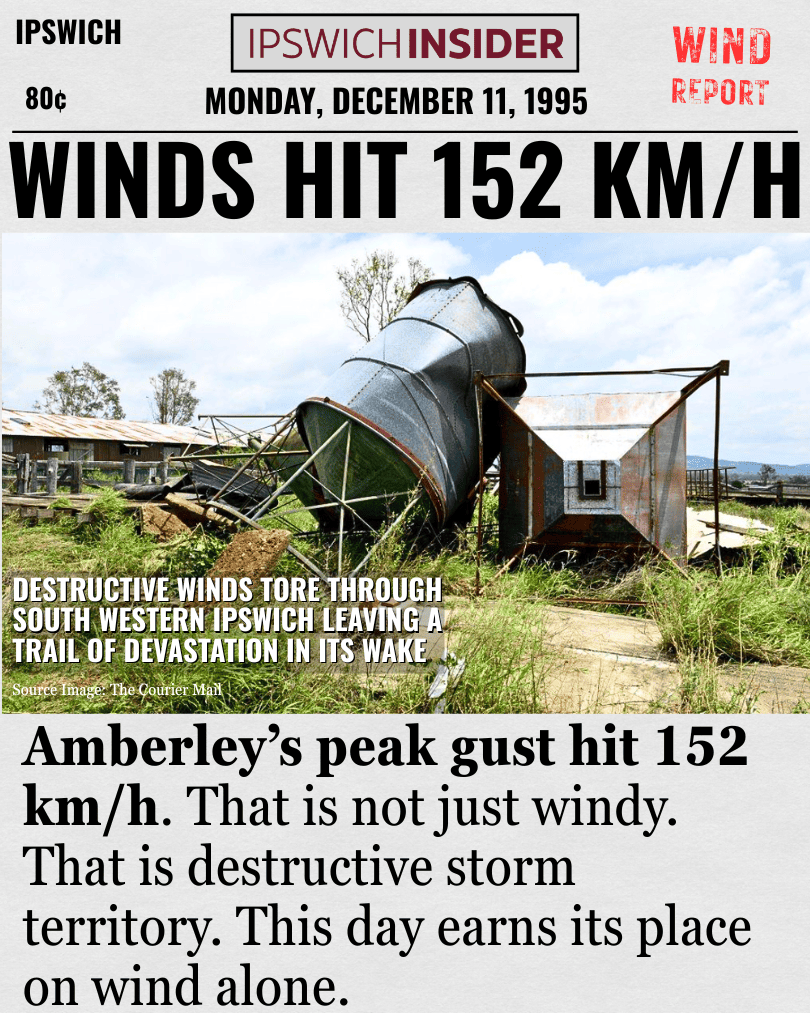
Destructive storm territory on wind alone
Every weather list needs a wind day. This is it. Amberley’s peak gust hit 152 km/h.
That is not just windy. That is destructive storm territory. This day earns its spot on wind alone.
Key Details
- Cyclone equivalent. 152 km/h matches a Category 2 tropical cyclone. Strong enough to bring down large trees and damage roofs.
- Reliable station. Amberley has one of the longest and most trusted wind records in the Ipswich area.
- BoM threshold. Gusts above 125 km/h are classified as destructive by the Bureau of Meteorology.
Alfred drowns Ipswich — 10 March 2025 — Rain
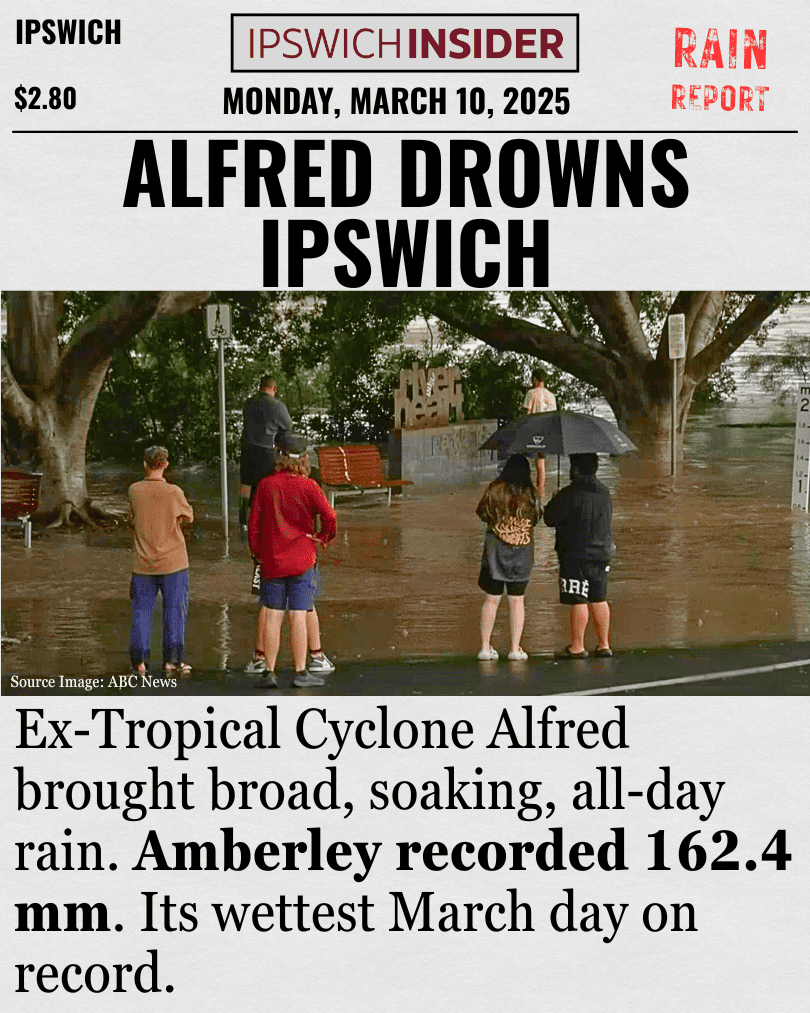
Ex-Cyclone Alfred dumps 162 mm
Most Ipswich storm days are short and sharp. This one was different. Ex-Tropical Cyclone Alfred brought broad, soaking, all-day rain.
Amberley recorded 162.4 mm. That is its wettest March day on record. The Bremer pushed toward major flood level.
Key Details
- Origin. Alfred crossed the coast as a tropical cyclone before weakening into a rain depression that stalled over south-east Queensland.
- Flood risk. The Bremer River pushed toward major flood level. Low-lying parts of Ipswich were put on alert.
- Different pattern. Unlike most Ipswich storm events, this was slow and steady rain over many hours. Not a short sharp burst.
44.6° on Boxing Day — 26 December 1972 — Heat
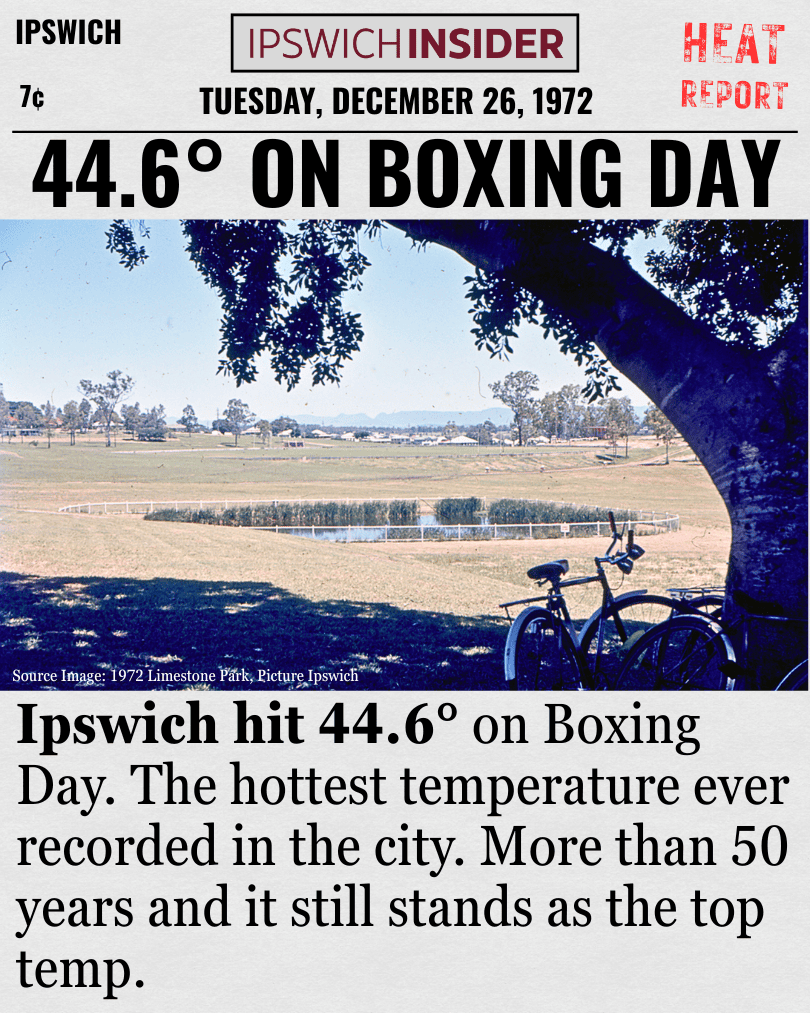
Original Image Source: Picture Ipswich
The hottest temperature ever recorded in Ipswich
No storm. No wind. Just heat. Ipswich hit 44.6 degrees. That is still the all-time record high for the site.
Amberley also reached 43.8 degrees that December. It is the hottest temperature ever recorded in Ipswich.
Key Details
- Amberley too. Amberley reached 43.8 degrees that same December. The heat was region-wide.
- Extreme outlier. 44.6 degrees is severe even by inland Queensland standards. Well above what Ipswich typically sees in summer.
- 50+ years unbroken. The Ipswich station’s record has stood for more than half a century without being matched.
3,000 strikes — 8 November 2016 — Lightning
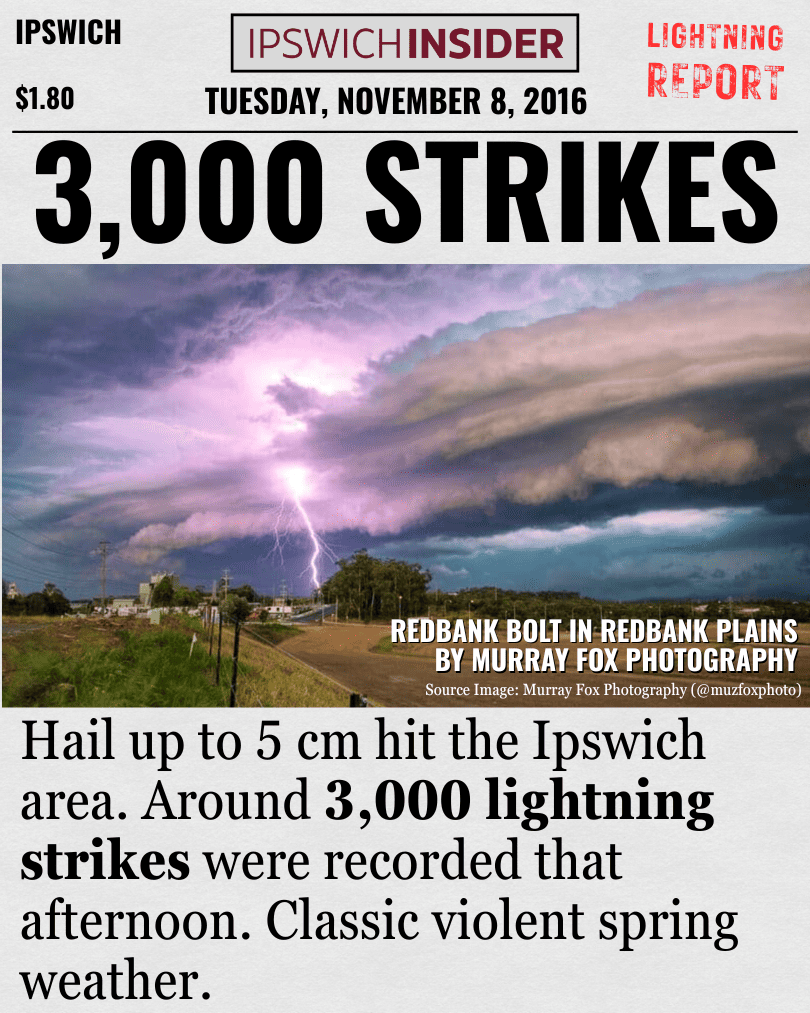
Source: @MuzFoxPhoto
Classic spring storm season
A violent spring storm rolled through with hail measured up to 5 cm in the Ipswich area. Around 3,000 lightning strikes were recorded that afternoon.
Big hail. A lot of electricity. Classic spring storm season in Ipswich.
Key Details
- Damage potential. 5 cm hail is large enough to crack windscreens and cause serious damage to exposed vehicles.
- Electrical activity. 3,000 lightning strikes in a single afternoon. That is an extremely active storm cell.
- Peak season. November is historically one of the most active months for severe thunderstorms in the Ipswich area.
6 days of hell — 6 January 1994 — Heat
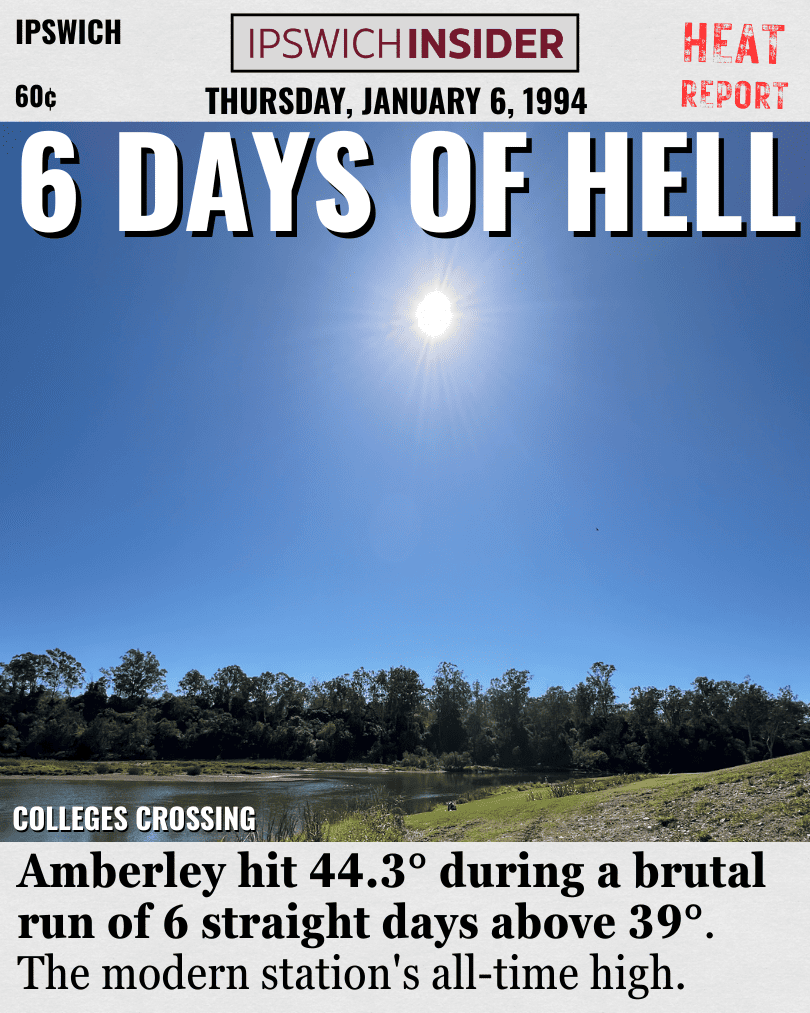
The modern station’s all-time high
If 1972 owns the old site record then this is the modern station’s worst. Amberley hit 44.3 degrees. Old Ipswich reached 43.4 degrees.
The Bureau noted that Amberley also had six straight days above 39 degrees during that stretch. It was not a one-off spike. It was a brutal run.
Key Details
- Sustained heat. Six straight days above 39 degrees. That kind of heat wears down everything. People. Animals. Power grids.
- Both stations. Old Ipswich still reached 43.4 degrees that day. The heat was not limited to Amberley.
- Not a spike. The sustained nature of this heatwave sets it apart from single-day temperature records.
-4.9° hits Ipswich — 8 August 1995 — Cold
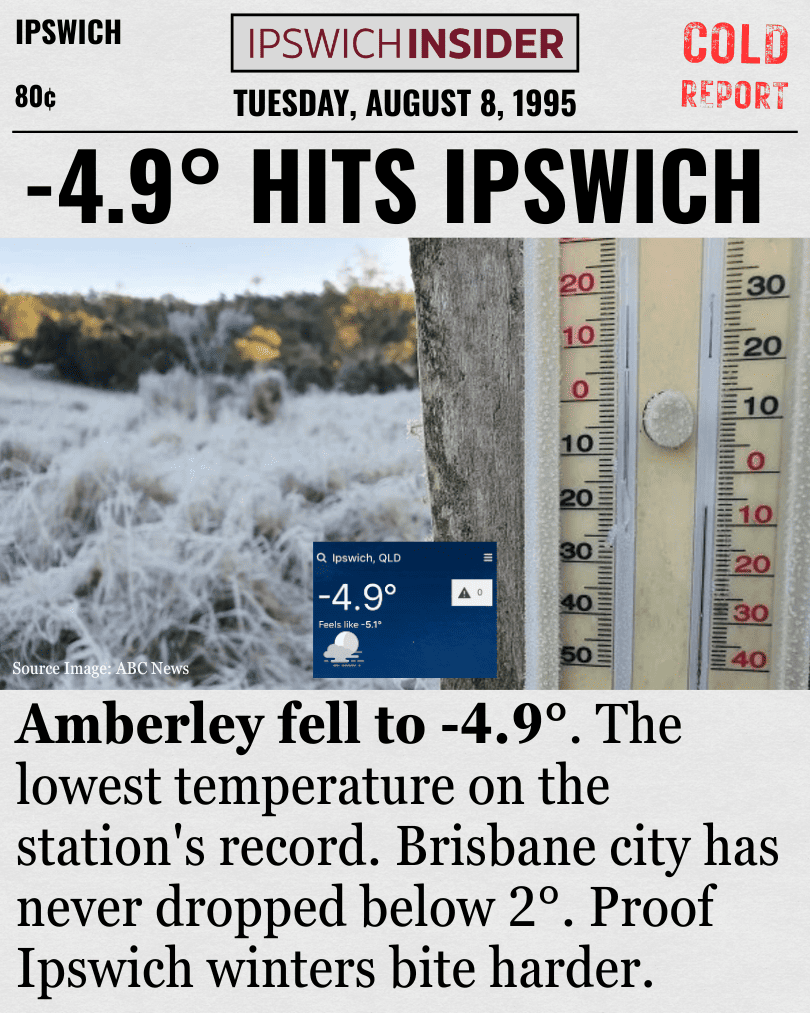
Proof Ipswich winters bite harder than Brisbane’s
Ipswich locals know their winter mornings can bite harder than Brisbane’s. This is the proof. Amberley fell to minus 4.9 degrees. That is the lowest temperature on the station’s record.
Brisbane city has never dropped below 2 degrees. Storms and heat dominate most weather lists. This is the cold morning that belongs right alongside them.
Key Details
- Hard frost. Minus 4.9 degrees is cold enough to damage crops and freeze standing water.
- Geography. Ipswich sits further inland and in a river valley. It regularly gets colder overnight than coastal Brisbane.
- Clear leader. This record has stood since 1995. It remains well clear of any other minimum recorded at Amberley.
Hail hits Flinders View — 15 February 2018 — Hail

A sharp reminder of how fast Ipswich storms hit
A late-afternoon storm hit Flinders View with golf-ball-sized hail. Several other suburbs copped 2 cm hail. Near Marburg, 61 mm dropped in under 30 minutes. More than 3,300 homes lost power by 5:30 pm.
Not the biggest event on this list. But a solid modern example of how quickly an Ipswich storm can cause real damage.
Key Details
- Localised hit. Flinders View and surrounding suburbs copped the worst. Other parts of Ipswich escaped with lighter damage.
- Wider hail. 2 cm hail fell across several suburbs beyond the worst-hit zone.
- Fast blackout. More than 3,300 homes lost power within a couple of hours of the storm arriving.
10.5° is the high — 15 July 1945 — Cold
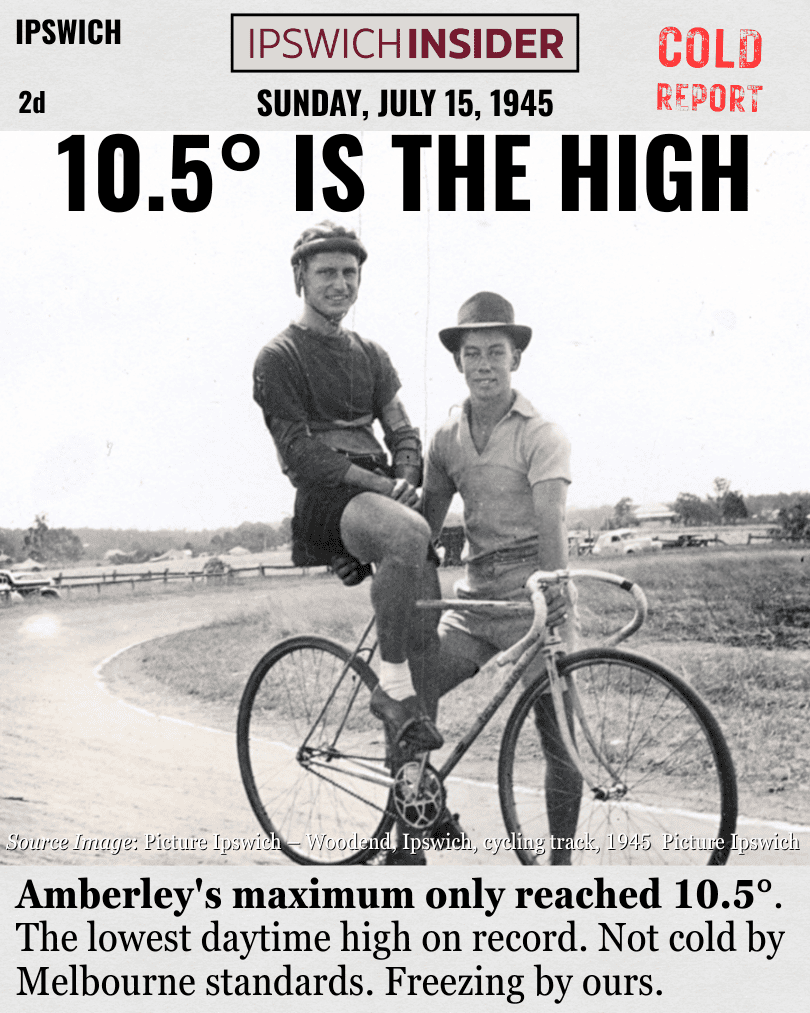
Source image: Picture Ipswich
The coldest whole day on record
This one is different. It was not about a freezing sunrise. The whole day stayed cold. Amberley’s maximum only reached 10.5 degrees. That is still its lowest daytime high on record.
Not cold by Melbourne standards. Freezing by ours.
Key Details
- Out of place. A maximum of 10.5 degrees in Ipswich is more like a winter day in southern New South Wales or Victoria.
- Different measure. Entry 12 was the coldest morning. This was the coldest whole day. Two different records.
- 80+ years unbroken. This record has stood since 1945. One of the longest-standing weather records in the area.
Introducing: ‘Swich Weather Widget
A fun weather tool for Ipswich only.
- Today’s Ipswich weather compared to last year.
- The forecast for the next 3 days.
- An “on this day” weather fact pulled from the historical record.
That’s ‘Swich Weather.
Bookmark it (updates daily):
Explore ‘Swich Weather Widget →

How We Picked These 14 Days — Full Methodology
The Goal
The goal was not to run every weather station number through a formula and spit out a ranking. It was to find the single days that Ipswich locals would recognise as genuinely huge. Then back those picks with official records and same-day reporting.
That is why the list covers heat, cold, hail, wind, rain and a few days where everything turned up at once.
Ipswich First, Not Brisbane
A lot of south-east Queensland weather stories are really Brisbane stories with Ipswich mentioned somewhere in the middle. Those were not enough on their own.
A day only stayed in the mix if the weather was:
- Clearly felt in Ipswich
- Measured at Ipswich or Amberley
- Documented in nearby localities like Rosewood, Tallegalla, Flinders View, Dinmore, Redbank and Riverview
The two core BoM stations used were Ipswich (site 040101, data from 1870) and Amberley AMO (site 040004, data from 1941). Those two give the cleanest historical spine for the city.
The Weather on the Day, Not the Flood a Week Later
A hard rule was used. The list ranks the weather that happened on the day. Not what the river did days later.
A flood peak day without standout same-day rainfall, wind or hail was not enough. River flooding, SES callouts and road closures were treated as supporting evidence. Not the thing being ranked.
That lines up with how the Bureau of Meteorology frames it. BoM classifies a thunderstorm as severe if it produces:
- Hail of 2 cm or more
- Wind gusts of 90 km/h or more
- Tornadoes
- Heavy rainfall that may lead to flash flooding
The weather is the hail, wind and rain. The flooding is the consequence. That is why days like 12 January 2011 were not pushed to the top just because the flood was huge.
Where the Numbers Came From
The backbone was BoM Climate Data Online. That is where all the hard numbers came from for:
- Temperature highs and lows
- Daily rainfall totals
- Peak wind gusts
But station records alone do not cover storm days well. A place can have a memorable hail event that does not set an all-time rainfall or temperature record. So the second layer was BoM severe weather summaries and Monthly Weather Reviews. ABC reporting filled in the Ipswich-specific local detail.
Lightning strike counts were treated carefully. BoM warns that its Severe Storms Archive is biased toward populated areas. Many storms go unrecorded. So lightning was used as supporting detail, not a ranking tool.
Five Buckets, Not Just 14 Rain Days
To stop the list turning into 14 versions of “it rained a lot”, the shortlist was built across five categories:
- Extreme heat
- Extreme cold
- Extreme rain
- Severe storm and hail
- Compound chaos days
That last one matters. Some of Ipswich’s wildest weather days do not win on a single stat. But they score high across the board with a strong mix of rain, hail, wind and local damage.
That is why a day like 18 December 2016 made the cut. It may not own one all-time record. But 100 km/h gusts, heavy rain and 4.5 cm hail across multiple Ipswich suburbs in one afternoon is about as wild as a single weather day gets.
What Missed Out
- Flood peak days that were not also standout same-day weather days were cut. The January 2011 river peak is the obvious example.
- Generic SEQ storm days that happened to clip Ipswich were also cut. Unless the local weather itself was clearly extreme.
- Duplicate events were dropped. No point keeping two average hail days when one clearly had bigger stones, cleaner numbers and stronger local reporting.
The final 14 is a balanced set of rain, heat, hail, wind and cold days that are extreme on the numbers and still make sense to someone who lives here.
Sources
- BoM Climate Data Online — temperature, rainfall and wind records for Ipswich and Amberley
- BoM Severe Storms Archive — hail, wind and lightning event records
- BoM Monthly Weather Reviews — detailed summaries of significant weather events
- Picture Ipswich — historical images used in the newspaper-style cards