Ipswich’s Busiest Roads at a Glance
- Motorways dominate – Motorways move long-distance traffic quickly via limited access points. Arterials connect suburbs and centres to those motorways and carry cross-town trips, while collectors and local streets handle short access runs.
- Springfield surge – The SEQ Western Growth Corridor—Greater Springfield and Ripley Valley—now drives many of Ipswich’s busiest roads. Major upgrades are underway to meet rising demand.
- Methodology – Used the busiest Ipswich count site on each corridor. TMR AADT “B” figures are two-way and used as reported. Council one-way counts were doubled. Counts were uplifted to Aug 2025, rounded to the nearest 1,000, then ranked.
📊 Busiest Roads in Australian Cities

Sydney – M4 at Homebush West
- Sydney – Warringah Freeway (near the harbour crossings): ~250,000 vehicles/day.
- Melbourne – West Gate Fwy (M1): 205,000+ vehicles/day across the bridge/freeway corridor
- Perth – Kwinana Fwy (Narrows Bridge): ~186,000 vehicles/day
- Brisbane – Pacific Mwy (M1, Eight Mile Plains): 150,000+ vehicles/day across the Brisbane–Gold Coast corridor
- Ipswich – Ipswich Mwy (Goodna): ~140,000 vehicles/day (your local count; matches TMR corridor patterns).
- Gold Coast – Pacific Mwy (M1, Varsity–Tugun): up to ~90,000 vehicles/day on the southern section
- Adelaide – North–South Corridor: “busiest” metropolitan corridor at ~70,000 vehicles/day
- Hobart – Tasman Bridge (Tasman Hwy): ~70,000 vehicles/day (highest in Tasmania)
- Canberra – Tuggeranong Parkway: roughly 35,000–40,000 vehicles/day
- Darwin – Stuart Hwy (near Duke St): about 24,700 vehicles/day
🚦 More Quick Facts
- 166,000 – Estimated number of cars across the Ipswich LGA
- 80 hours – Ipswich drivers lost time to road congestion in 2024
Jump to a road:
- Ipswich Motorway
- Cunningham Highway (Dinmore)
- Warrego Highway
- Centenary Motorway
- Cunningham Highway (Yamanto–Willowbank)
- David Trumpy Bridge / East St
- Sinnathamby Boulevard
- Augusta Parkway
- Springfield Greenbank Arterial
- Springfield Parkway
- Old Toowoomba Road
- Ripley Road
- Limestone Street
- Redbank Plains Road
- Brisbane Street
- Collingwood Drive
- Mary Street
- Formation Street
- Junction Road
- Waterworks Road
- Pine Street
Or, jump to:
Have you crawled through the Cunningham Hwy queue at the Ripley Rd southbound exit?
Ever wondered what the hard numbers say about that bottleneck—and the other choke-points around Ipswich?
You’re in the right place.
We’ve parked the hearsay and crunched the data. This report pinpoints exactly where traffic stacks up across the Ipswich LGA.
Counts are apples-to-apples: council one-way figures doubled to two-way, older counts uplifted to August 2025.
Use it to identify real hotspots, target upgrades that free the flow, and invest where each dollar moves the most people.
Gear up, find your road, and see what should happen next.
Explore More Ipswich Gold
1. 137,000 Cars/Day–Ipswich Motorway.
TMR Site 140035 – West of Church St ramps (two-way AADT B). Goodna.

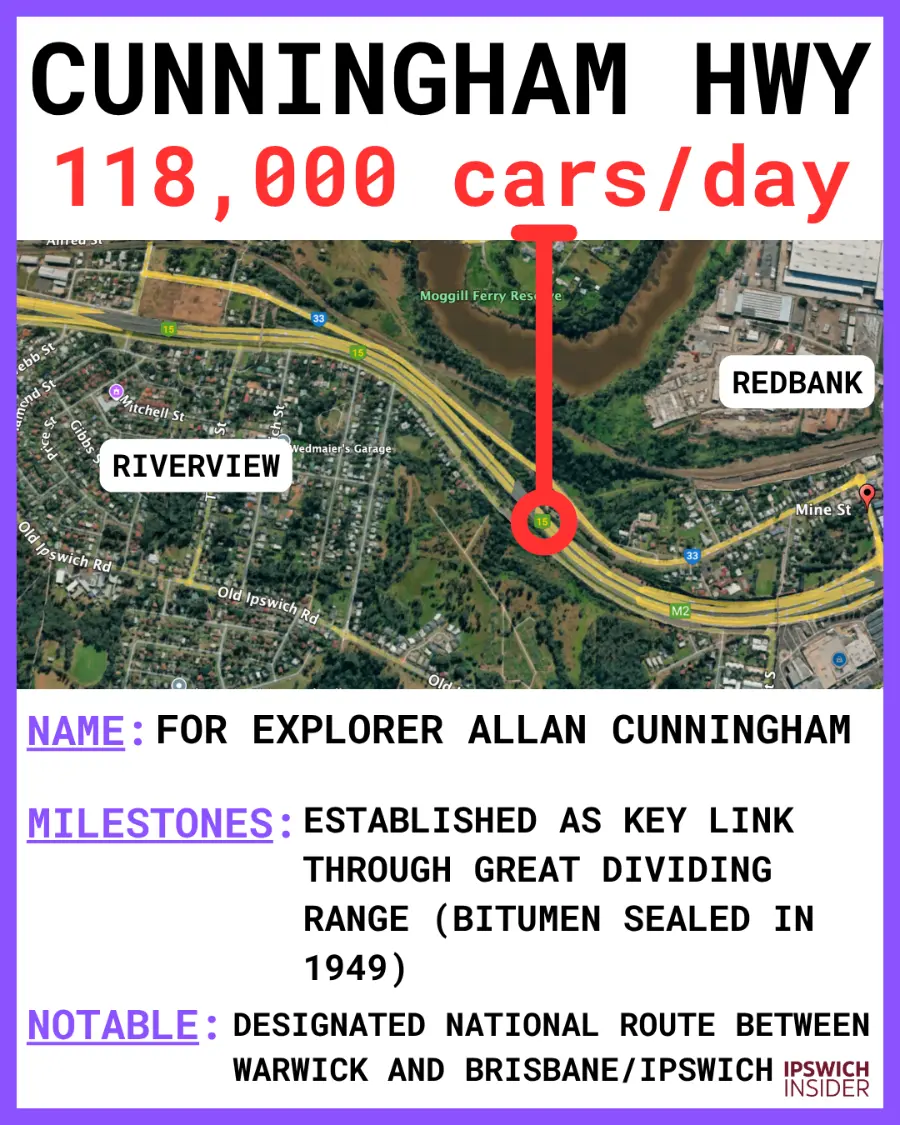
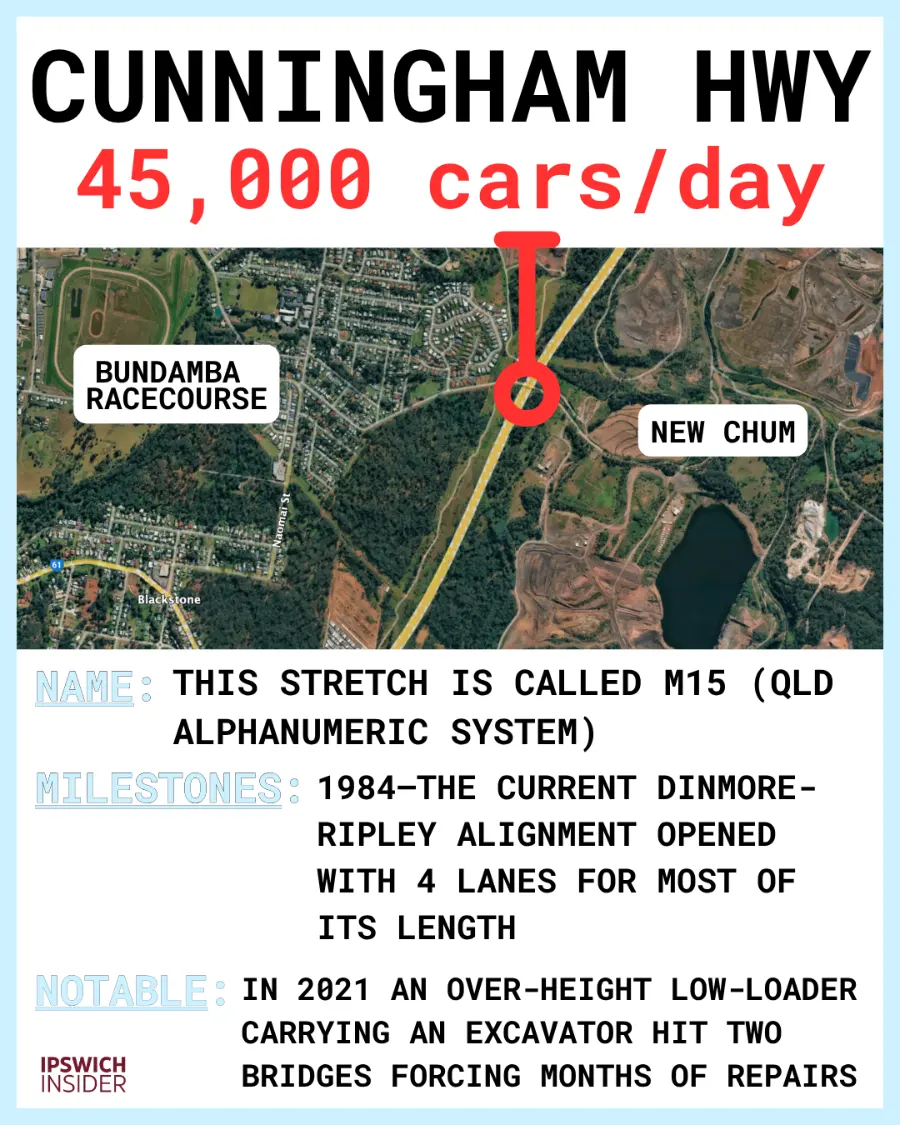
2. 118,000 Cars/Day–Cunningham Highway (Dinmore).
TMR Site 140027 – at Mine St (Dinmore split). Redbank.
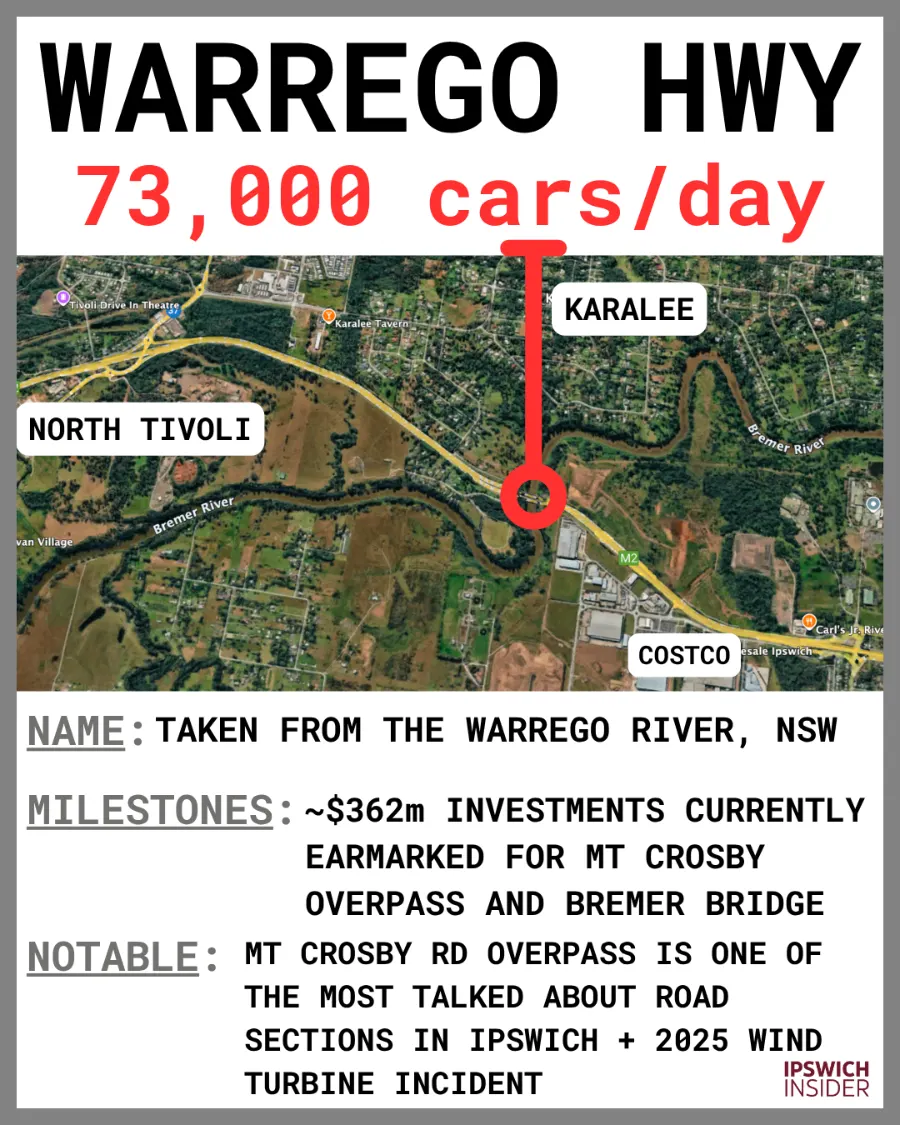
3. 73,000 Cars/Day–Warrego Highway.
TMR Site 135546 – Weigh-in-Motion at Bremer River (Blacksoil/North Tivoli). North Tivoli / Muirlea.
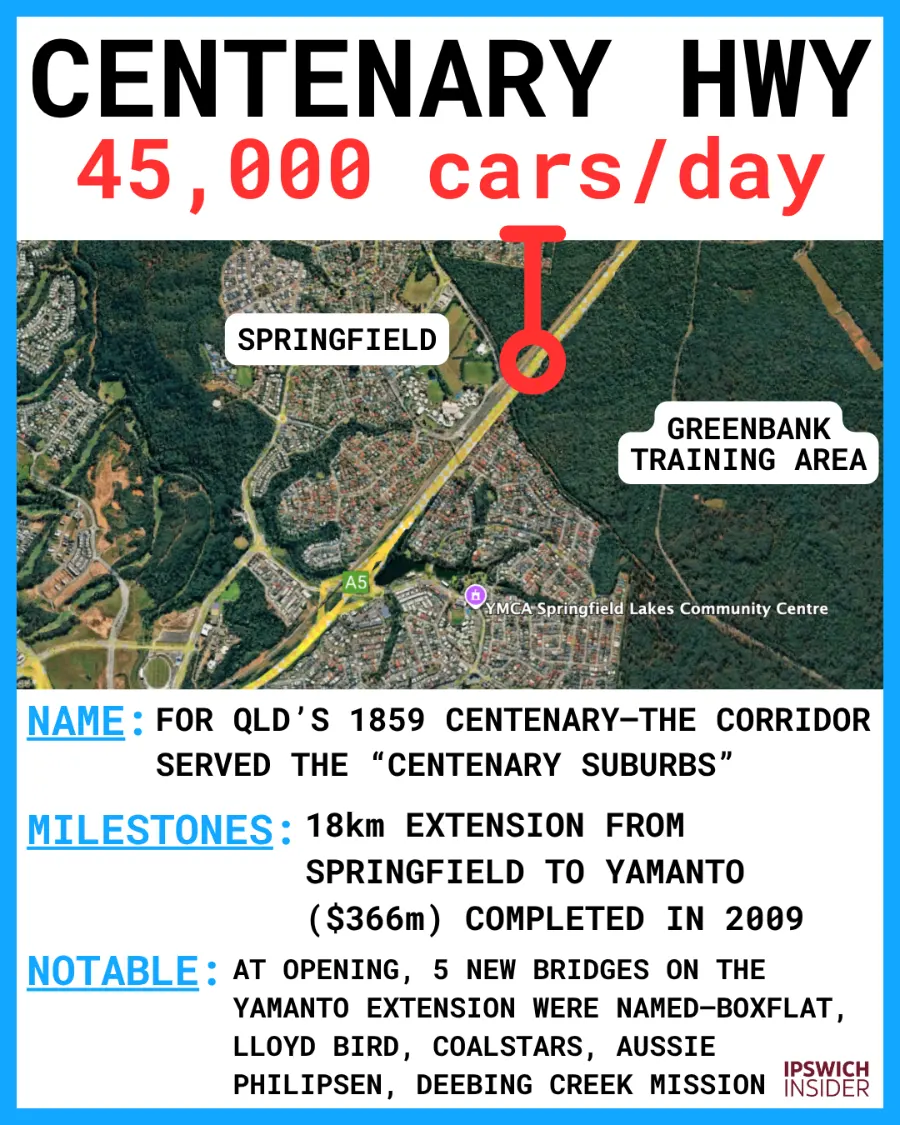
4. 45,000 Cars/Day–Centenary Motorway.
TMR Site 135763 – Sandy Creek Bridge (Ipswich side). Carole Park.
5. 45,000 Cars/Day–Cunningham Highway (Yamanto–Willowbank).
TMR Site 140001 – South of Barclay St rail overpass. Yamanto / Willowbank.
6. 44,000 Cars/Day–David Trumpy Bridge / East St.
Council figure (2022) – Bremer River bridge (East St ↔ The Terrace). Ipswich / North Ipswich.

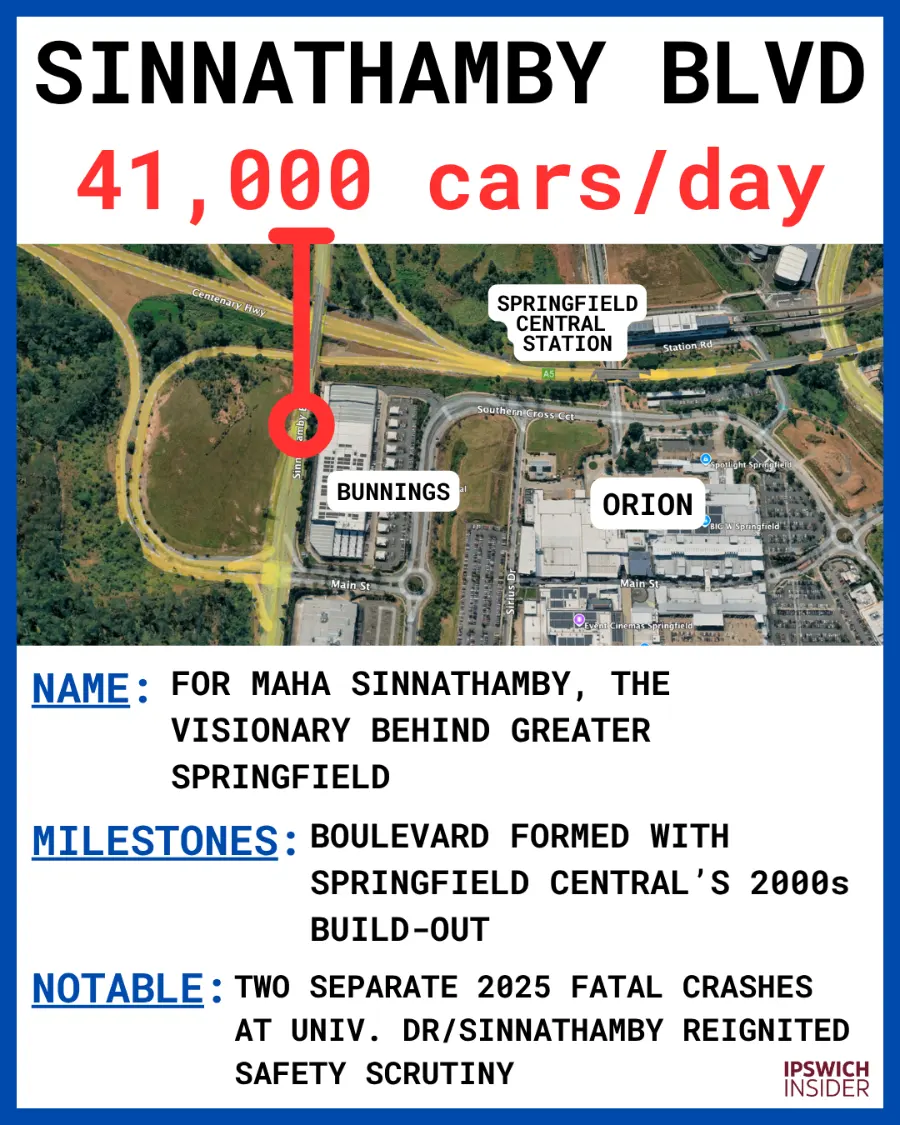
7. 41,000 Cars/Day–Sinnathamby Boulevard.
ICC counter 10116 – ~200 m north of Main St (direction: Northbound). Springfield Central.
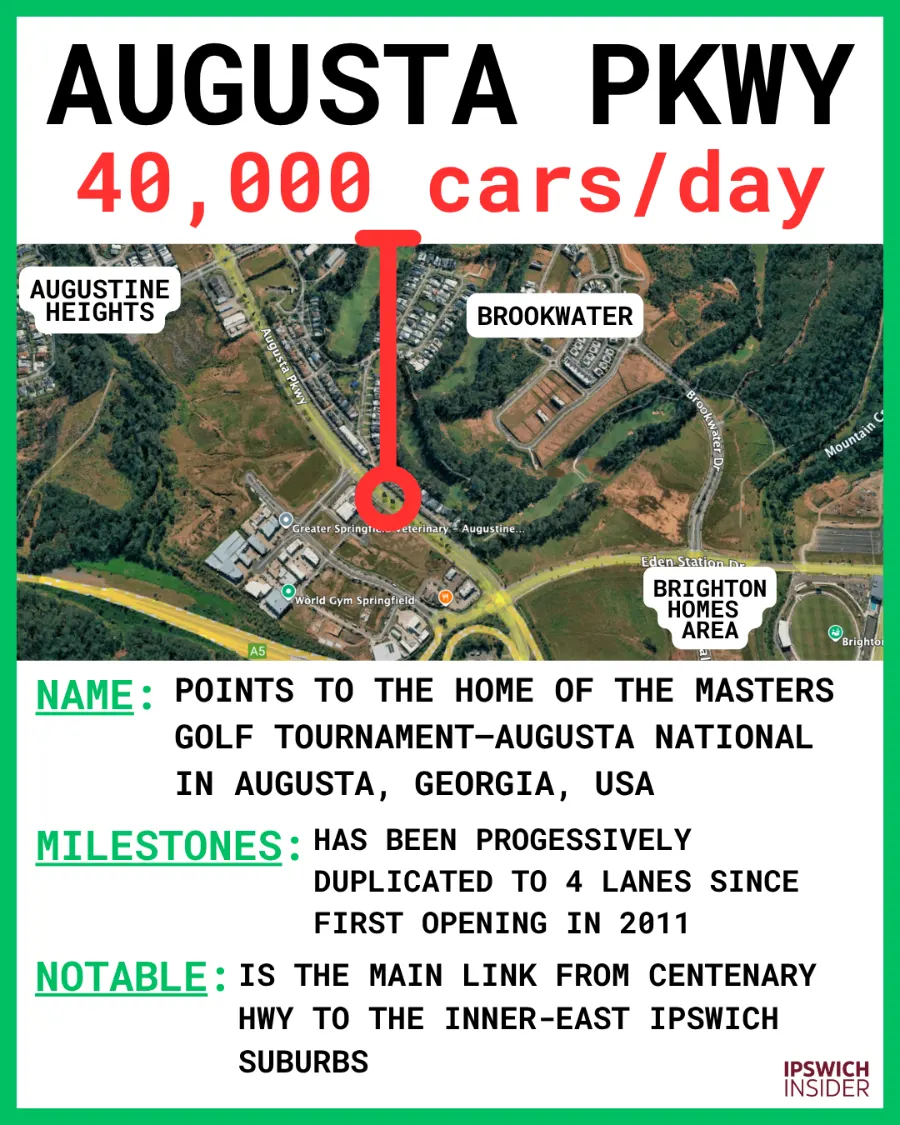
8. 40,000 Cars/Day–Augusta Parkway.
ICC counter 9945 – 200 m south of Technology Dr (direction: Southbound). Augustine Heights.
9. 33,000 Cars/Day–Springfield Greenbank Arterial.
ICC counter 9929 – Between Main St & Sinnathamby Blvd (direction: Southbound). Springfield Central.

10. 32,000 Cars/Day–Springfield Parkway.
ICC counter 10128 – Between Springfield Greenbank Arterial & Escarpment Dr (direction: Eastbound). Springfield.

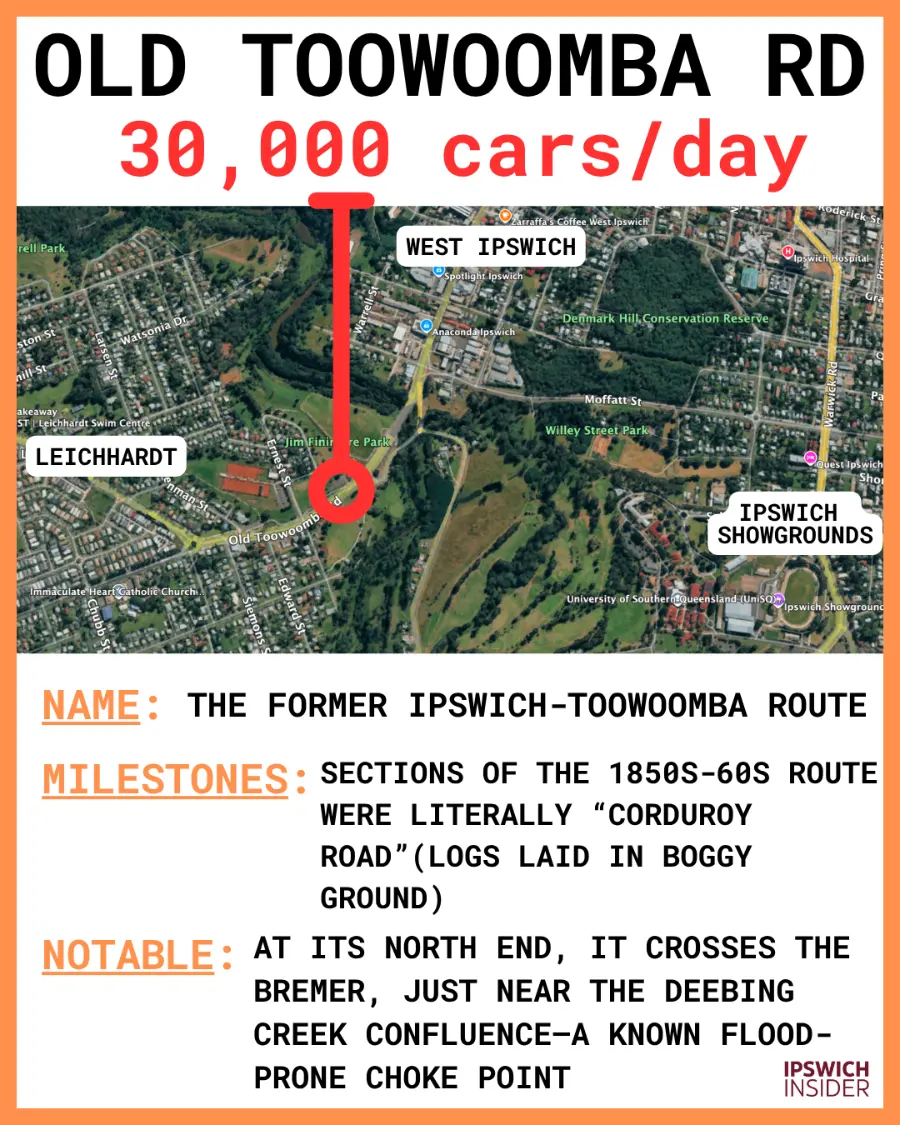
11. 30,000 Cars/Day–Old Toowoomba Road.
ICC counter 10157 – Between Lobb St & Ernest St (direction: Northbound). Leichhardt / One Mile.
12. 27,000 Cars/Day–Ripley Road.
ICC counter 10191 – 100 m south of Cunningham Hwy (direction: Northbound). Ripley.

13. 25,000 Cars/Day–Limestone Street.
ICC counter 9897 – ~10 m west of Foote Lane (direction: Westbound). Ipswich.

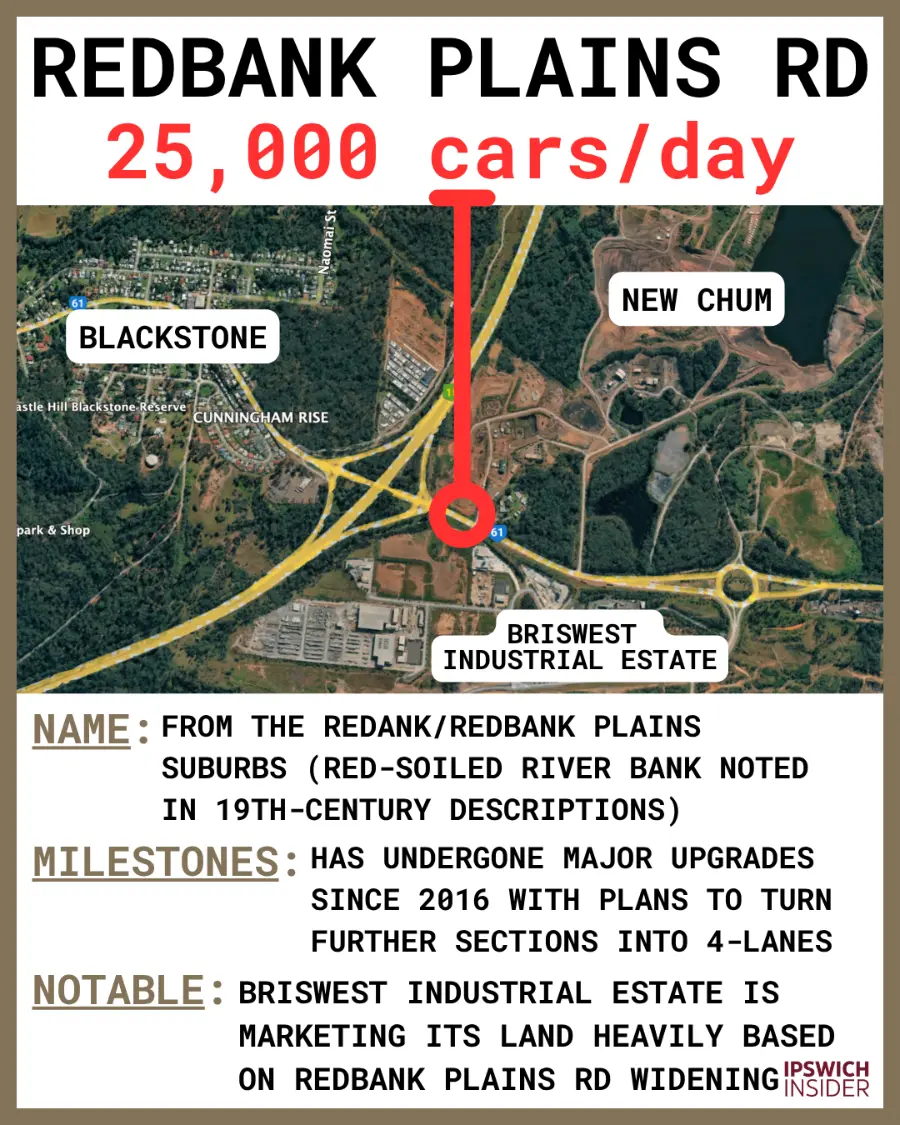
14. 25,000 Cars/Day–Redbank Plains Road.
ICC counter 10087 – Between Cunningham Hwy & Austin St (direction: Westbound). New Chum / Swanbank.
15. 23,000 Cars/Day–Brisbane Street.
ICC counter 10162 – Between Keogh St & Hooper St (direction: Southbound). West Ipswich.

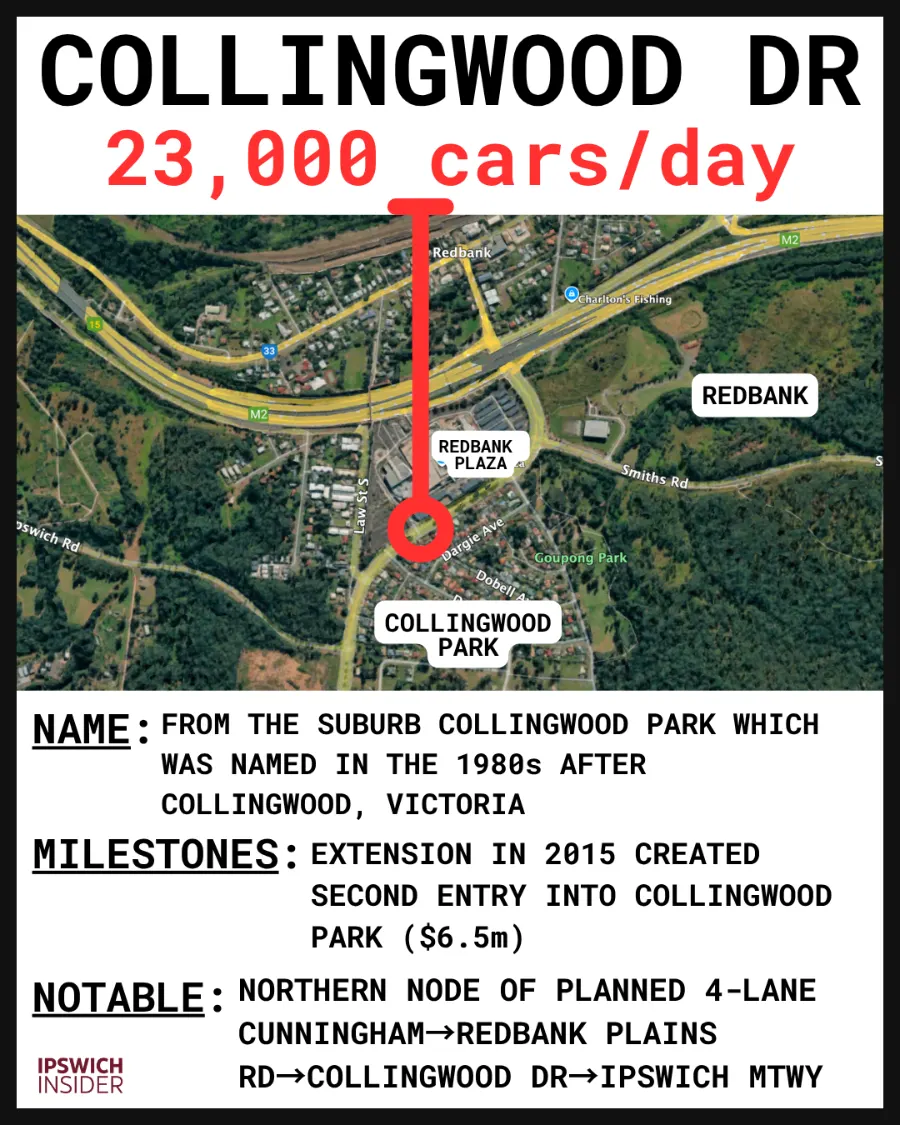
16. 23,000 Cars/Day–Collingwood Drive.
ICC counter 10079 – Between Drysdale St & Namatjira Dr (direction: Southbound). Collingwood Park.
17. 22,000 Cars/Day–Mary Street.
ICC counter 10048 – ~100 m west of Cunningham Hwy (direction: Eastbound). Blackstone.

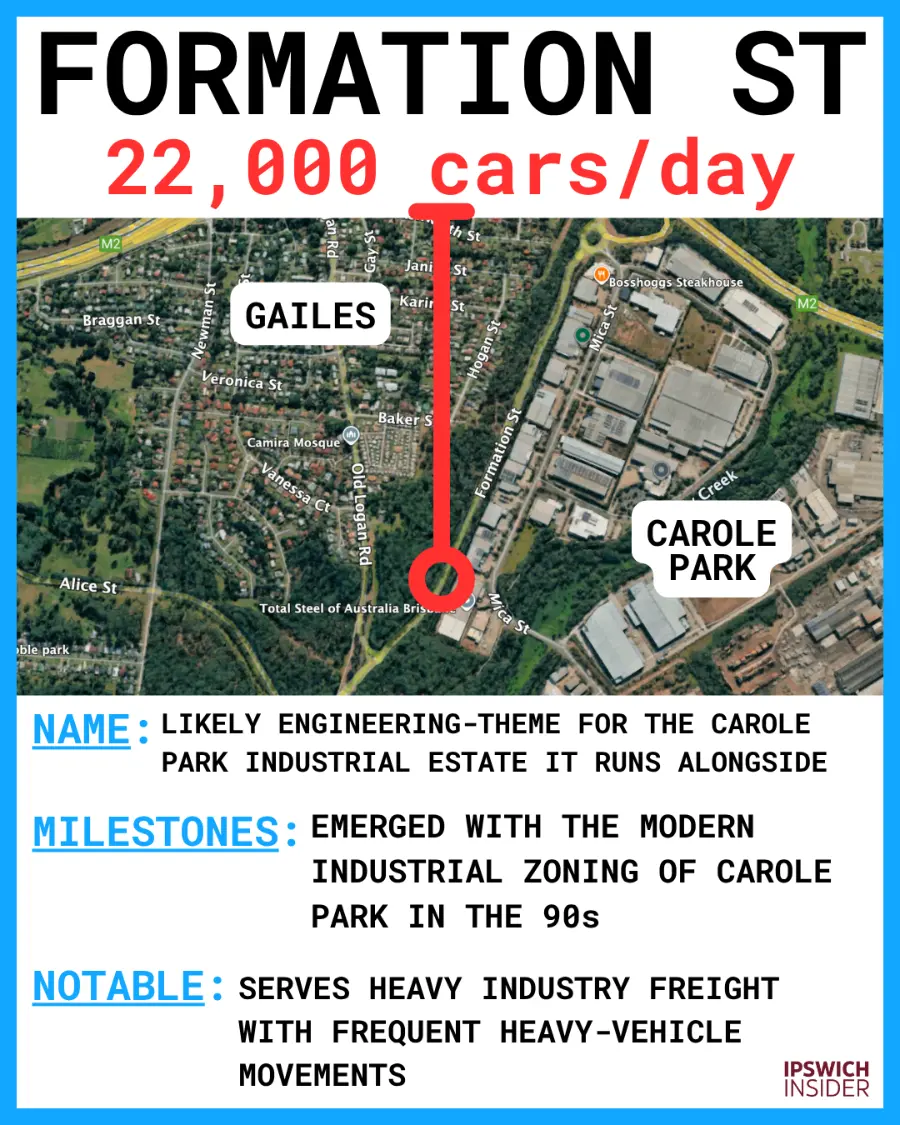
18. 22,000 Cars/Day–Formation Street.
ICC counter 10098 – ~200 m north of Old Logan Rd (direction: Northbound). Carole Park.
19. 21,000 Cars/Day–Junction Road.
ICC counter 10136 – Between Mt Crosby Rd & shopping centre access (direction: Eastbound). Karalee.

20. 20,000 Cars/Day–Waterworks Road.
ICC counter 10140 – ~40 m south of Holmes St (direction: Northbound). North Ipswich.

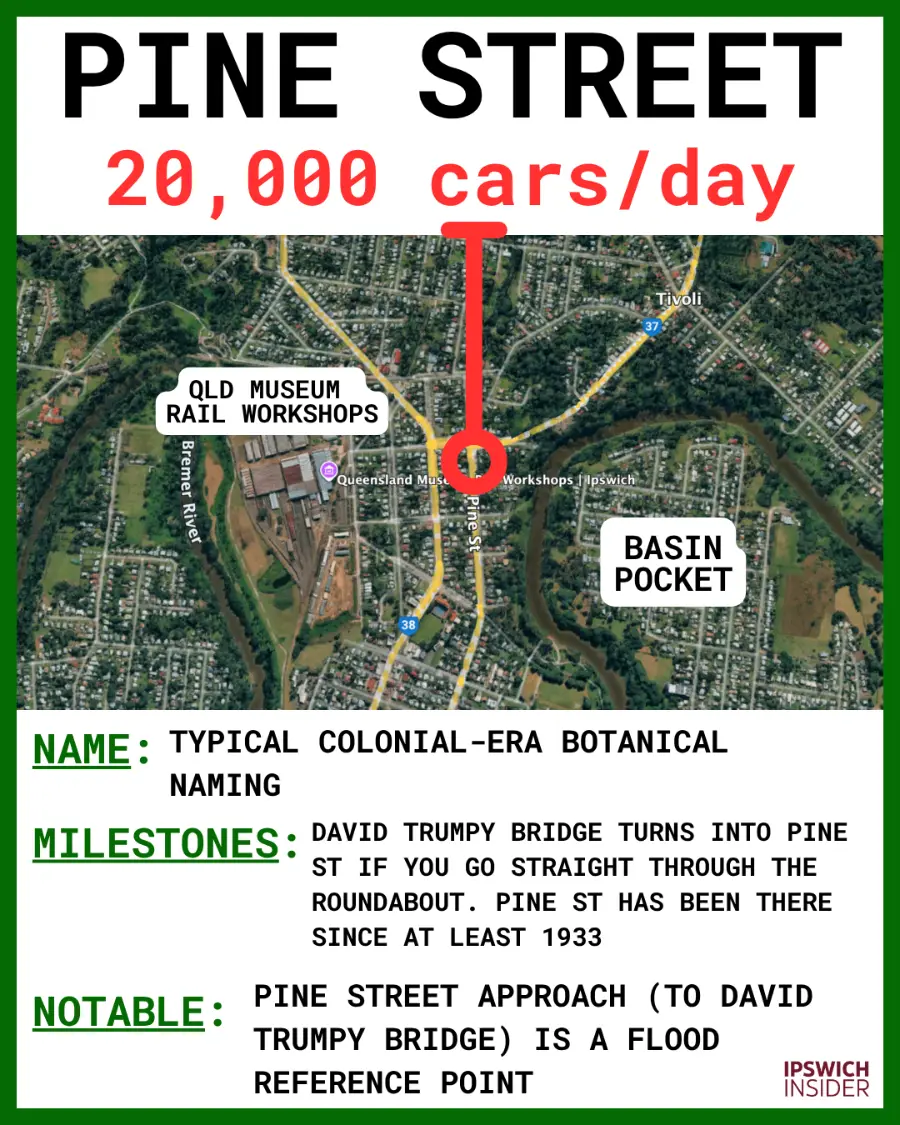
21. 20,000 Cars/Day–Pine Street.
ICC counter 9873 – ~40 m north of Ferguson St (direction: Southbound). North Ipswich.
⚖️ How Government Decides Where to Spend on Roads
- Funding funnel. All state road spending flows through a four-year plan called QTRIP, and any idea must pass 5 government sign-offs—from problem statement to final business case—before money is released.
- Red flags. A section gets flagged when data shows it is running close to full capacity, a clear cluster of crashes over five years, or population forecasts point to heavy growth within ten years.
- Options first. Planners model every sensible fix—extra lanes, new signals, a roundabout, bus lanes, even ways to cut demand—and carry forward only the best performer.
- Smart widening. Extra lanes alone rarely rate highest. The successful Ipswich Motorway upgrade widened the road and closed 3 ramps plus added a service road to keep local trips off the main traffic.
- Tech boosts. Smart-motorway tools such as ramp signals and variable-speed signs can lift flow by about 10% without new pavement.
- Roundabout limits. Roundabouts usually cut serious crashes by roughly 70% on 60 km/h roads, but once volumes top ~2,000 cars an hour, adaptive traffic lights move traffic better.
- Induced demand. Appraisers allow for “induced traffic”, meaning some of the new space is quickly taken by extra trips, so only the lasting time savings count.
- Local levers. Ipswich City Council can hurry smaller jobs by pairing its own funds or developer levies with the state’s Transport Infrastructure Development Scheme.
- Benefit mix. In real cost-benefit tests, travel-time savings often make up more than half the total score, with safety and flood resilience adding most of the rest—as shown on the Ipswich Motorway case.
- Pre-approved. If a project is already listed in the current QTRIP tables, the early gates are cleared. Community efforts are best spent refining its scope or timing, not re-arguing the need.
⚙️ Methodology
How this “Top 21 Busiest Roads in Ipswich” list was built
What “busiest” means: Each corridor is ranked by the highest average daily two-way traffic recorded at a single count point located inside the Ipswich LGA. One entry per corridor (the busiest Ipswich-side point wins).
Sources: Queensland Department of Transport and Main Roads (TMR) Annual Average Daily Traffic segment reports and Ipswich City Council automatic traffic counters.
AADT, in one line: Annual Average Daily Traffic (AADT) is the average number of vehicles per day across a whole year. In TMR reports, the “B” value is already two-way (both directions).
Making the numbers comparable
- TMR sites: used the AADT “B” value as-is (already two-way).
- Council sites: counters are directional (one-way), so the figure was doubled to estimate two-way and clearly marked as an estimate.
- Inside-Ipswich only: if a corridor crosses the boundary, the last/first Ipswich-side counter was used (e.g., Centenary Motorway at Sandy Creek Bridge rather than Jindalee).
- Names vs declared sections: TMR titles sites by the declared (gazetted) road (e.g., “Cunningham Highway (Ipswich Motorway), Section 17A”). The list shows the everyday road name first, then the declared section and exact site label for traceability.
Updating to today (August 2025)
- Generous uplift: Older baselines were increased to reflect growth to Aug 2025, then rounded to the nearest 1,000.
- Factors applied: 2018→2025 +25%; 2019→2025 +22%; 2020→2025 +18%; 2021→2025 +14%; 2022→2025 +10%; 2023→2025 +6%; 2024→2025 +3%. (Chosen to reflect Ipswich’s rapid population and vehicle growth.)
Ranking rules
- Sorted by the uplifted 2025 two-way volume (highest to lowest).
- Ties resolved deterministically: TMR AADT ahead of estimated council figures, then higher baseline, then alphabetical.
What to keep in mind: AADT smooths weekends and holidays, so it won’t show peak-hour pain; some corridors are capacity-constrained and may grow more slowly than population, while fast-growing feeders (e.g., Springfield/Ripley) can outpace the average.
Sources
- Ipswich Traffic Counters. maps.ipswich.qld.gov.au.
- Traffic census for the Queensland state-declared road network. data.qld.gov.au.
- National Freight Data Hub: Harmonised Traffic Counts. datahub.freightaustralia.gov.au.